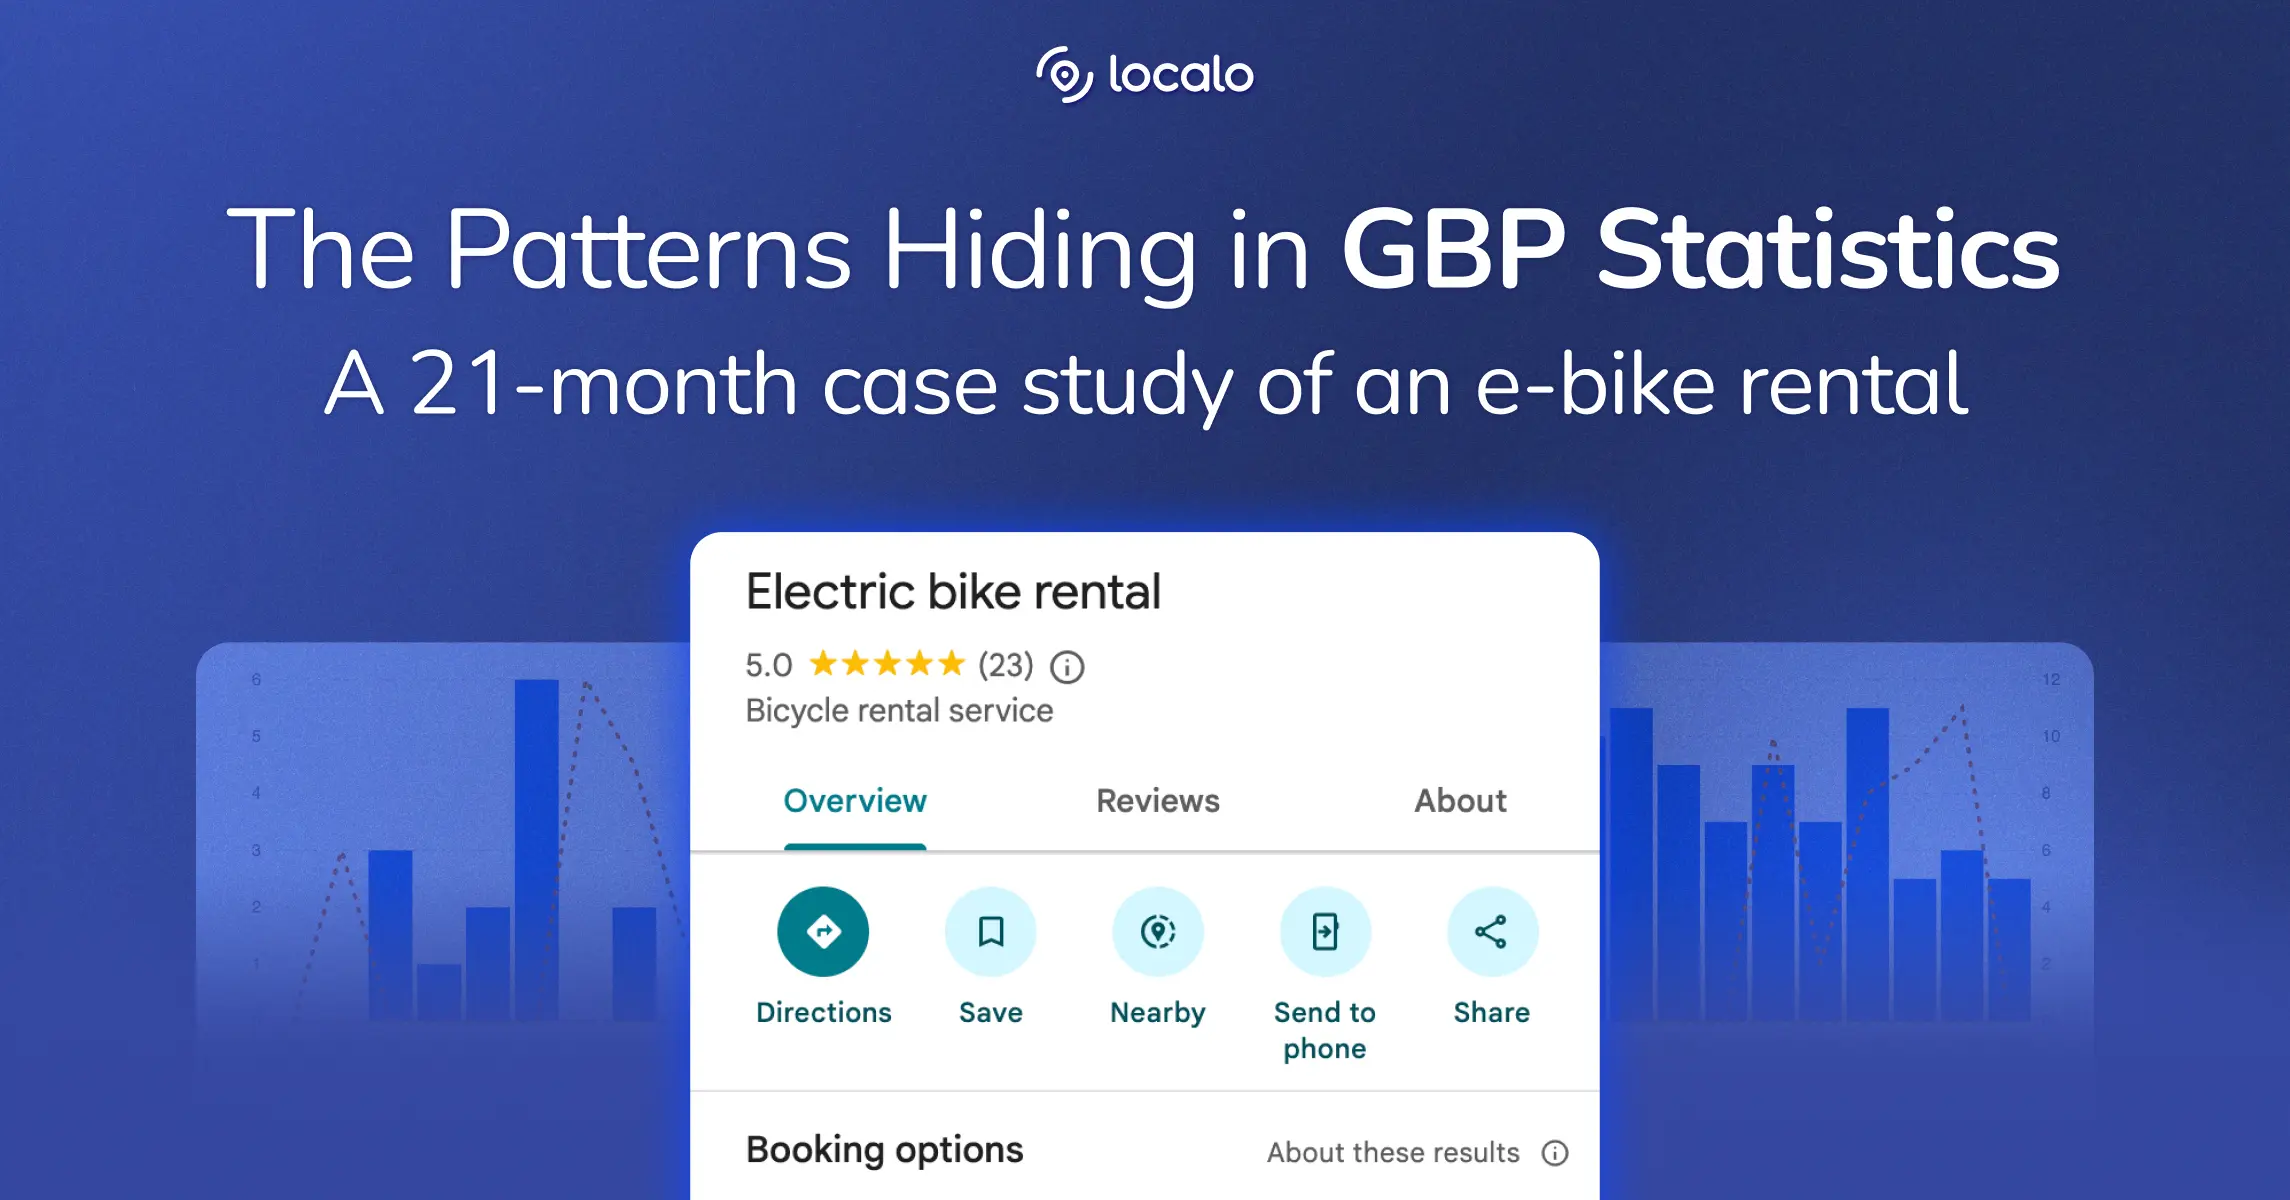
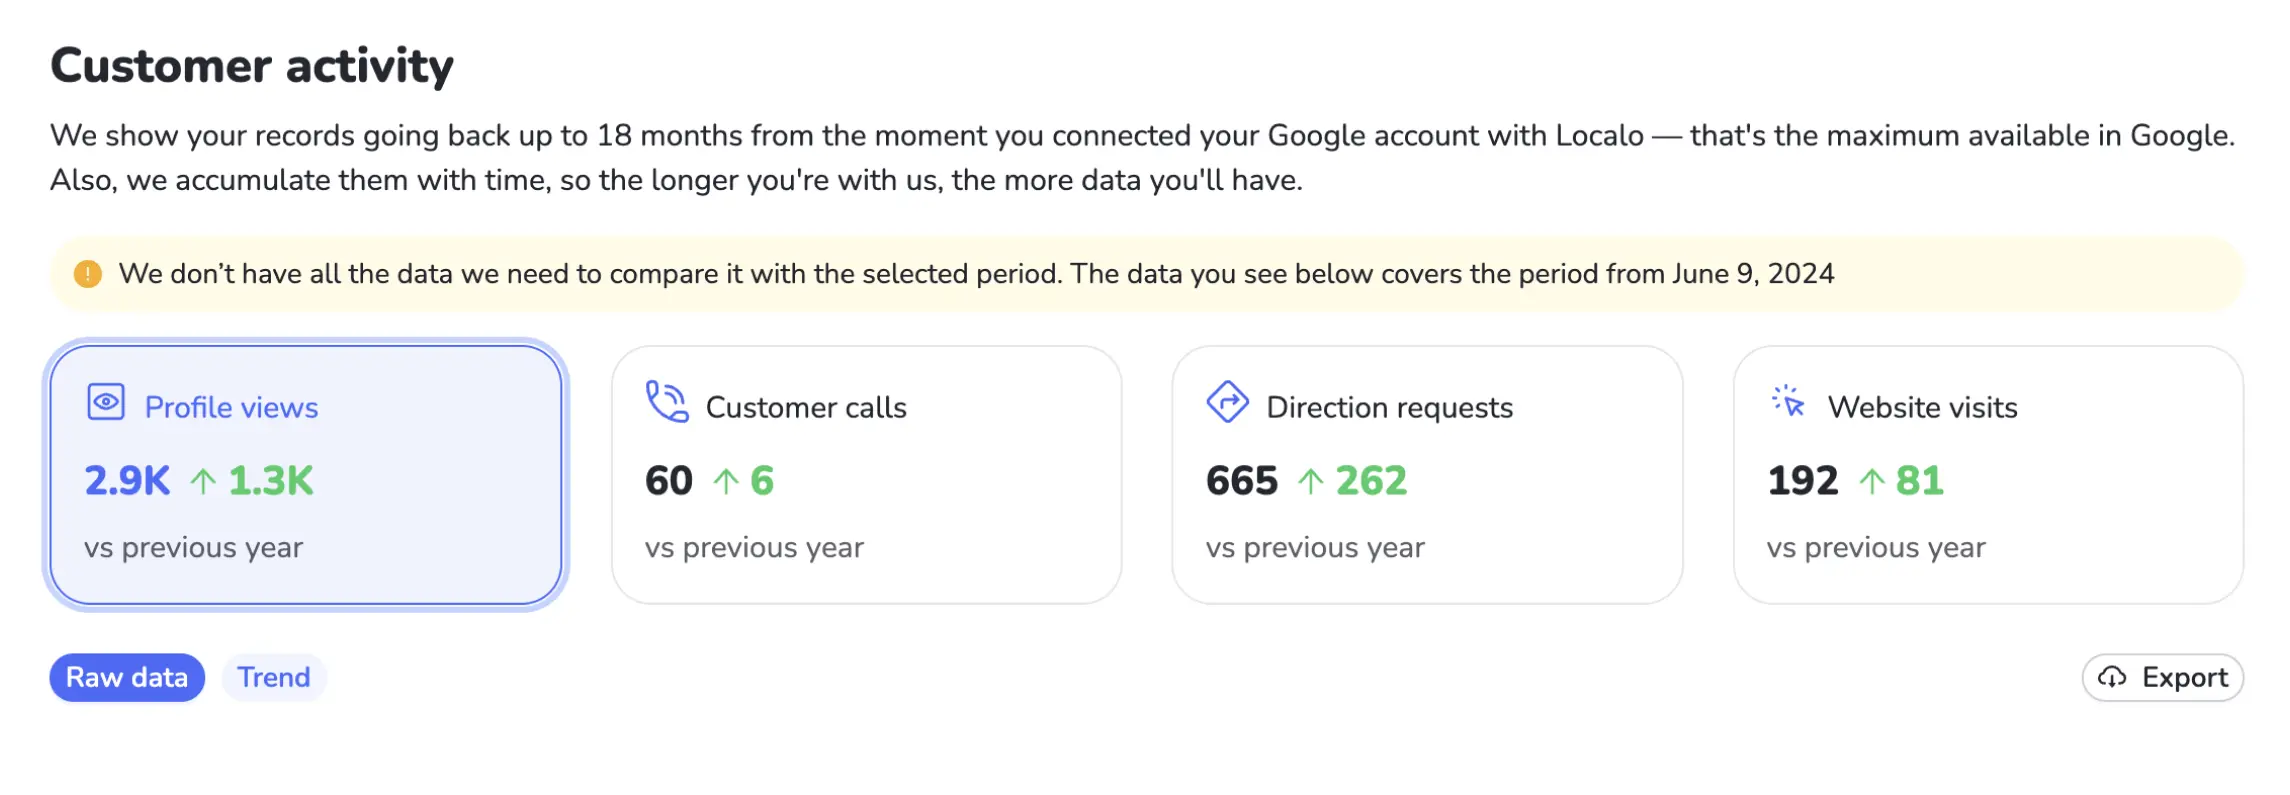
This analysis covers 21 months of Google Business Profile Statistics from an e-bike rental business in Poland’s Beskid Niski mountain region, from June 9, 2024, to February 28, 2026.
The data includes profile views, direction requests, phone calls, website clicks, reviews, and content publication records. Breaking it down by metric and time period reveals patterns worth looking at.
Direction requests kept coming through the winter months, even though the business published limited winter content. And the ratio of direction requests to profile views was actually higher in December than in August.
This analysis shows how the Statistics feature in your Google Business Profile can help spot patterns that might otherwise go unnoticed. All data was collected through Localo’s Statistics feature, a local SEO tool for optimizing Google Business Profiles.
Data scope: Daily performance data from June 9, 2024, through February 28, 2026. All data collected via Localo’s Statistics feature.
Business profile: E-bike rental service near Magura National Park, offering electric bicycle rentals with safety equipment and online and phone reservations.
Limitations: This analysis covers a single business at a single location. It doesn’t include booking data, revenue, or direct customer feedback. Correlations observed don’t prove causation.
Profile Views Follow a Predictable Seasonal Curve for a Mountain E-Bike Rental
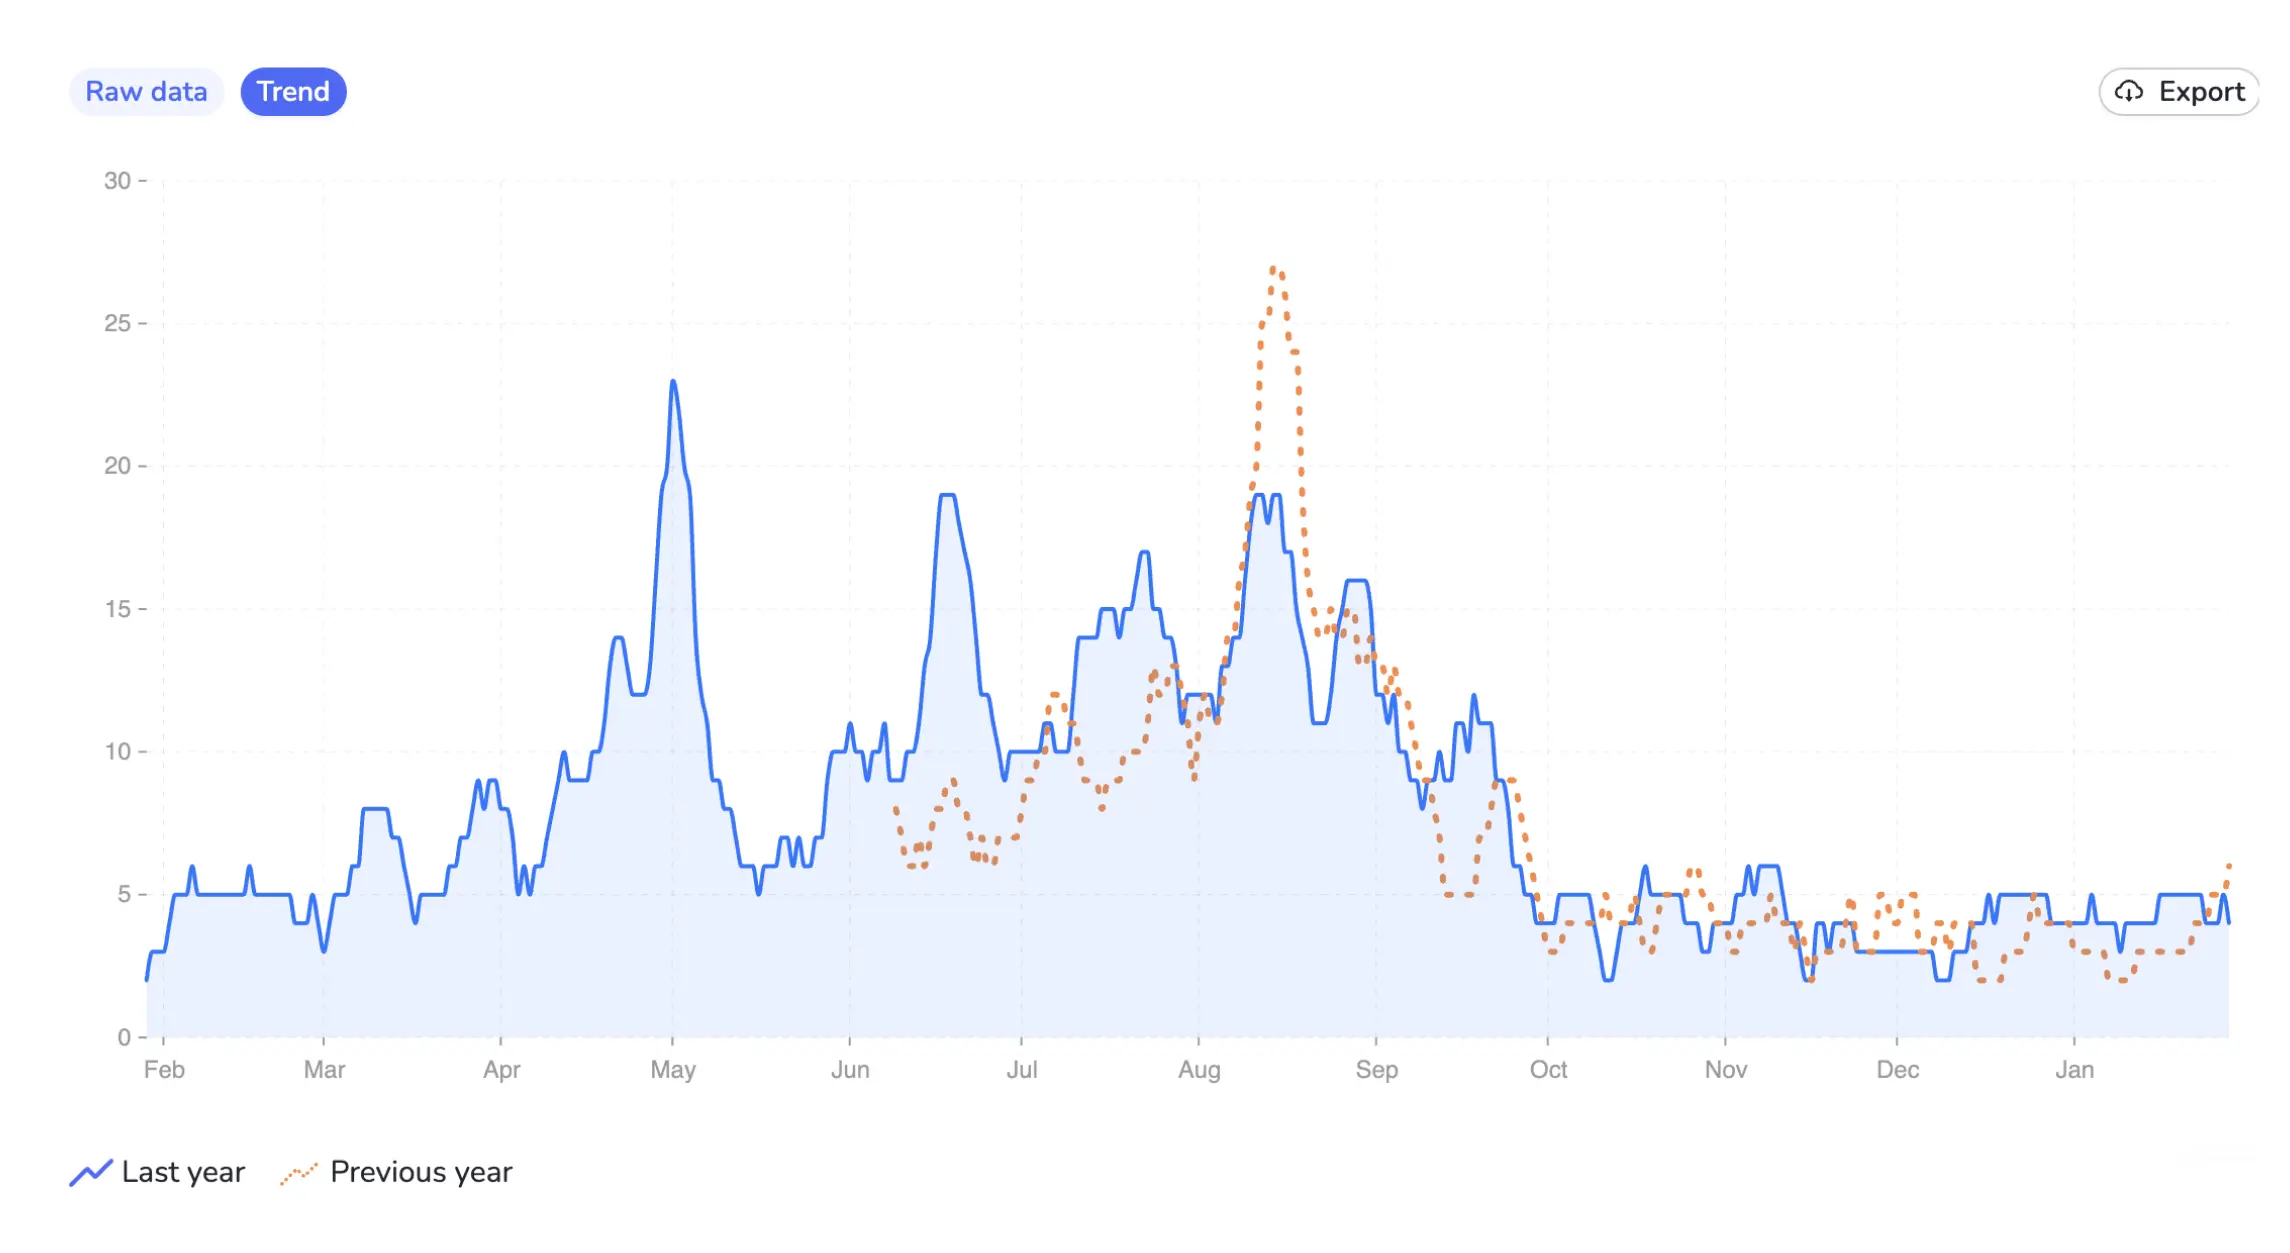
The profile views data show a clear seasonal curve. Views rise in spring, peak in summer, and drop sharply in autumn.
Peak season (May through September):
- Daily views averaged 10-15, with regular spikes above 20
- Highest single day: 49 views on August 15, 2024 (Assumption Day, a public holiday in Poland)
- Second highest: 37 views on May 1, 2025 (Labor Day long weekend)
Off-season (October through February):
- Daily views dropped to 0-7
- Multiple days with zero views in November and December
- Average settled around 3-5 views per day
Transition months:
- March: views began climbing (6-13 per day)
- Late April: acceleration started (15-21 per day)
- October: sharp decline immediately after September
| Period | Average Daily Views | Highest Single-Day Views |
|---|---|---|
| Summer (Jun-Aug 2024) | 12 | 49 |
| Summer (Jun-Aug 2025) | 13 | 29 |
| Winter (Nov 2024-Feb 2025) | 3 | 12 |
| Winter (Nov 2025-Feb 2026) | 4 | 12 |
Key takeaway: This pattern isn’t surprising for an e-bike rental in the mountains. What matters is how the other metrics behave during these same periods.


Calls and Website Clicks Nearly Disappear in Winter, Even While Direction Requests Continue
When profile views drop in winter, you’d expect all other metrics to drop as well. That’s partly true. Calls and website clicks nearly vanish. But direction requests tell a different story.
Winter 2024/2025:
| Month | Direction Requests | Calls | Website Clicks |
|---|---|---|---|
| November 2024 | 45 | 1 | 0 |
| December 2024 | 53 | 0 | 1 |
| January 2025 | 30 | 0 | 1 |
| February 2025 | 47 | 0 | 9 |
| Total | 175 | 1 | 11 |
Winter 2025/2026:
| Month | Direction Requests | Calls | Website Clicks |
|---|---|---|---|
| November 2025 | 50 | 2 | 8 |
| December 2025 | 52 | 0 | 6 |
| January 2026 | 34 | 0 | 4 |
| February 2026 | 66 | 0 | 1 |
| Total | 202 | 2 | 19 |
Total calls across all eight winter months: 3. Total direction requests across the same period: 377.
Key takeaway: People are still finding the business and want to know how to get there. But they’re not taking the next step.
Direction Requests Don’t Follow the Same Pattern as Profile Views
Profile views in winter drop to about 40% of summer levels (883 in winter vs 2,235 in summer). If all metrics followed the same curve, direction requests should drop to roughly the same proportion.
They don’t.
Winter direction requests reach 99% of summer levels (377 vs 380), despite having only 40% of the visibility.
Summer Months (Jun-Aug):
| Month | Profile Views | Direction Requests | View-to-Direction Rate |
|---|---|---|---|
| June 2024 | 161 | 45 | 28.0% |
| July 2024 | 321 | 48 | 15.0% |
| August 2024 | 524 | 68 | 13.0% |
| June 2025 | 366 | 69 | 18.9% |
| July 2025 | 404 | 57 | 14.1% |
| August 2025 | 459 | 93 | 20.3% |
| Summer Total | 2,235 | 380 | 17.0% |
Winter Months (Nov-Feb):
| Month | Profile Views | Direction Requests | View-to-Direction Rate |
|---|---|---|---|
| November 2024 | 77 | 45 | 58.4% |
| December 2024 | 80 | 53 | 66.2% |
| January 2025 | 80 | 30 | 37.5% |
| February 2025 | 125 | 47 | 37.6% |
| November 2025 | 122 | 50 | 41.0% |
| December 2025 | 111 | 52 | 46.8% |
| January 2026 | 139 | 34 | 24.5% |
| February 2026 | 149 | 66 | 44.3% |
| Winter Total | 883 | 377 | 42.7% |
This gap suggests something different about winter visitors.
Winter Visitors Convert from View to Direction Request at 2.5x the Summer Rate
The ratio of direction requests to profile views tells the story.
Summer average: 17.0% of profile views convert to direction requests.
Winter average: 42.7% of profile views convert to direction requests.
People who find this business in winter are 2.5 times more likely to request directions than those who find it in summer.
Key takeaway: Lower visibility doesn’t mean lower conversion intent.
The Gap Between Direction Requests and Calls Suggests a Conversion Barrier
Direction requests show intent to visit. Calls show intent to book.
In summer, both metrics are active. In winter, one drops to nearly zero.
| Period/Month | Direction Requests | Calls | Direction-to-Call Ratio |
|---|---|---|---|
| Summer | |||
| June 2024 | 45 | 1 | 45:1 |
| July 2024 | 48 | 9 | 5:1 |
| August 2024 | 68 | 34 | 2:1 |
| June 2025 | 69 | 6 | 12:1 |
| July 2025 | 57 | 16 | 4:1 |
| August 2025 | 93 | 9 | 10:1 |
| Winter | |||
| November 2024 | 45 | 1 | 45:1 |
| December 2024 | 53 | 0 | — |
| January 2025 | 30 | 0 | — |
| February 2025 | 47 | 0 | — |
| November 2025 | 50 | 2 | 25:1 |
| December 2025 | 52 | 0 | — |
| January 2026 | 34 | 0 | — |
| February 2026 | 66 | 0 | — |
In two summers, calls ranged from 6 to 34 across 6 months. In 2 winters, the total number of calls across eight months was 3.
What could explain this?
The Statistics data doesn’t answer this directly. But looking at what the GBP showed during these months offers a hypothesis:
- No winter-specific offers were active
- No posts mentioned winter availability
- Photos likely showed summer scenery
A visitor who finds this profile in December can see how to get to the location, but there is no confirmation that the business is operating in winter.
Key takeaway: The data show high-intent visitors (377 direction requests during the winter months) who rarely convert into calls (3 total). Without booking or customer feedback data, we can’t confirm why. But the pattern points to a gap between what visitors want and what the GBP communicates.
The Same Pattern Repeated Across Two Winters
If the winter patterns appeared only once, they could be random. The data covers two full winters, allowing comparison.
Winter 2024/2025 vs Winter 2025/2026:
| Metric | Winter 2024/2025 | Winter 2025/2026 |
|---|---|---|
| Profile Views | 362 | 521 |
| Direction Requests | 175 | 202 |
| Calls | 1 | 2 |
| Website Clicks | 11 | 19 |
| View-to-Direction Rate | 48.3% | 38.8% |
Both winters show the same pattern:
- Profile views at off-season levels (362 vs 521)
- Direction requests remain relatively strong (175 vs 202)
- Calls nearly disappear (1 vs 2)
- Website clicks remain minimal (11 vs 19)
- Winter view-to-direction rate stays well above the summer average of 17%
Month-by-month comparison:
| Month | 2024/25 Views | 2025/26 Views | 2024/25 Dirs | 2025/26 Dirs |
|---|---|---|---|---|
| November | 77 | 122 | 45 | 50 |
| December | 80 | 111 | 53 | 52 |
| January | 80 | 139 | 30 | 34 |
| February | 125 | 149 | 47 | 66 |
Direction requests in November and December remained consistent across both years: 45 vs 50 in November, 53 vs 52 in December. February 2026 showed the highest winter direction request count at 66.
Key takeaway: The pattern isn’t a one-time anomaly. Over two winters, the data show the same pattern: steady direction requests, near-zero calls, and high view-to-direction conversion. This consistency suggests a structural gap rather than seasonal noise.
What the Content Publishing Data Tells Us
Beyond the core metrics, Localo Statistics tracks what you publish on your profile: posts, photos, and offers. We analyzed whether publishing activity correlated with changes in views, directions, calls, or clicks.
Posts and photos
This business published 76% of its posts during the summer and shoulder seasons, when all metrics are naturally higher anyway.
| Content Type | Summer (Jun-Aug) | Shoulder (Mar-May, Sep-Oct) | Winter (Nov-Feb) |
|---|---|---|---|
| Posts | 15 (52%) | 7 (24%) | 7 (24%) |
| Photos | 35 (28%) | 63 (51%) | 25 (20%) |
That publishing pattern makes it impossible to separate content impact from seasonality. The business was active on its profile when business was good, not necessarily the other way around.
Year-over-year comparisons reinforced this. July 2025 outperformed July 2024 by 26% in views despite having zero posts compared to four posts the previous July. September 2025 beat September 2024 with no posts versus one post.
Could content amplify engagement during high season, even if it doesn’t cause it? That’s a reasonable hypothesis. But the July comparison argues against it: fewer posts, better results. We can’t isolate an amplification effect from this data either.
The data doesn’t tell us that posts and photos have no effect. It tells us this dataset can’t answer the question. To properly test whether publishing drives engagement, a business would need to post consistently across all seasons, then compare controlled periods.
Offers
This business kept an offer active for 15.5 of the 21 months in our dataset.
| Period | Offer | Duration | Avg Monthly Views | Avg Monthly Directions |
|---|---|---|---|---|
| July 2024 – May 2025 | Offer 1 | 10.5 months | 217 | 49 |
| June – October 2025 | Offer 2 | 5 months | 325 | 69 |
The shorter offer coincided with stronger engagement. A time-limited promotion could create urgency that a nearly year-long offer doesn’t. But 2025 also showed higher overall engagement than 2024 across most metrics, so we can’t isolate offer duration as the cause.
Key takeaway: Publishing content when business is good doesn’t prove the content caused the good business. To measure content impact, publish consistently across all seasons, then compare. Testing shorter promotions during specific periods could help see if scarcity messaging converts browsers into visitors.
Summary
This analysis looked at 21 months of Google Business Profile Statistics from one e-bike rental business in Poland’s Beskid Niski region. The data revealed patterns that wouldn’t be visible from rankings or general traffic numbers alone.
What the data showed:
-
Profile views followed a predictable seasonal curve. The summer months averaged 373 views per month. Winter months averaged 110. This aligns with expectations for a seasonal business.
-
Direction requests didn’t follow the same curve. Summer averaged 63 direction requests per month. Winter averaged 47. Despite having only 40% of summer’s visibility, winter retained 99% of summer’s direction request volume.
-
Winter visitors converted at 2.5x the summer rate. 42.7% of winter profile views turned into direction requests, compared to 17.0% in summer. People who found this business in winter were more likely to want to visit.
-
Calls nearly disappeared in winter. Across eight winter months, total calls: 3. Total direction requests in the same period: 377. Something stopped high-intent visitors from taking the next step.
-
The pattern repeated across two winters. Both 2024/2025 and 2025/2026 winters showed the same behavior: steady direction requests, near-zero calls, and high conversion rates from view to direction.
-
Content publishing followed seasonality, not the other way around. This business published 76% of posts during the summer and shoulder seasons. Year-over-year comparisons showed months with fewer posts sometimes outperformed months with more. The data can’t isolate whether content drives engagement or simply reflects when the business is active.
-
The shorter offer coincided with stronger engagement. Two offers ran during this period: one for 10.5 months, one for 5 months. The shorter offer showed higher average views and directions, but 2025 was also stronger overall, so we can’t isolate duration as the cause.
What the data doesn’t show:
- Whether direction requests turned into actual visits or bookings
- Why visitors didn’t call (no customer feedback data)
- Whether content publishing drives engagement (the publishing pattern mirrored seasonality, making it impossible to separate cause from correlation)
- How this business compares to others in the region
What this suggests for using Statistics:
The gap between direction requests and calls in winter points to potential demand that isn’t converting. The data can’t prove why, but it raises a question worth investigating: would making winter availability clearer change the outcome?
Statistics won’t give you answers. But breaking down the data by metric and time period can surface questions you didn’t know to ask.