
Our easy-to-read Statistics show how your Google Business Profile performs over time. Get up to 18 months of data from day one and then build a full 24-month view over time. Spot posts that brought calls, photos that got clicks, and weeks with the most searches. Compare to interpret patterns and plan your next steps to capitalize on what works.
Start 14 days free🦾 Trusted with 44,000+ Google Business Profiles
Check when and how customers interact with the profile. Compare numbers weekly, monthly, quarterly or yearly with up to 2 years of accumulated data.
See which photos, offers or posts increased visitors and engagement. Observe patterns, growth, or sudden drops, and use that to effectively grow your or your client's business.
Show your good work by sending clients a white-label link—a simple way to share your results without extra tools or formatting.
We turn your core metrics into easy-to-read visuals. Pick a week, month, quarter or year, and compare it with the previous one. Raw data and trend view allow you to see daily fluctuations as well as long-term signals. Check customer activity against published content to see what brings traffic. And then send your clients a white-label link with the summary.
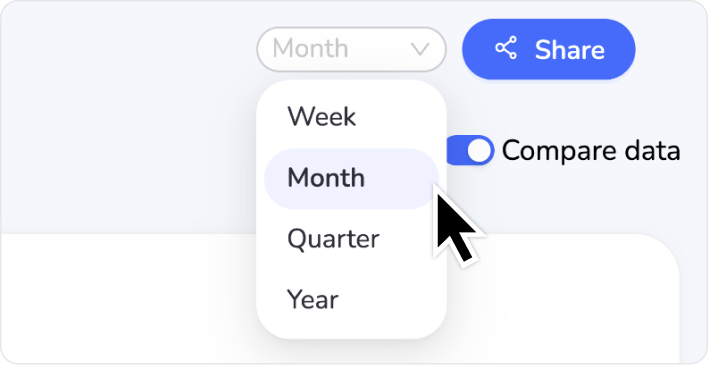
Choose between week, month, quarter, and year analysis with a single click. Google gives you 6 months—we show you up to 2 years, in one clear overview.
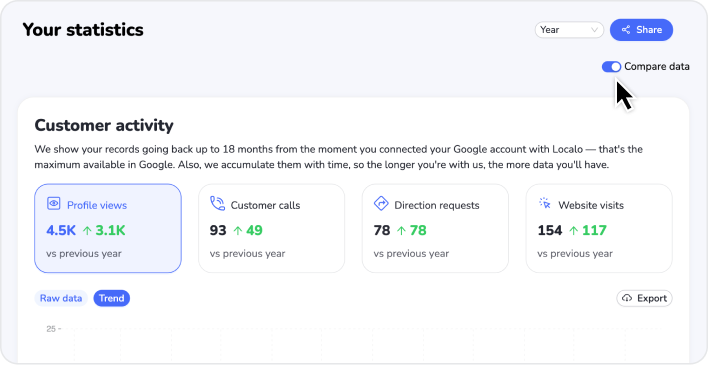
Want to see a month-to-month or a year-to-year analysis? Just turn on comparison. No extra spreadsheets, no switching between tabs. And if you want to go deeper, export data to a CSV or a JSON file.
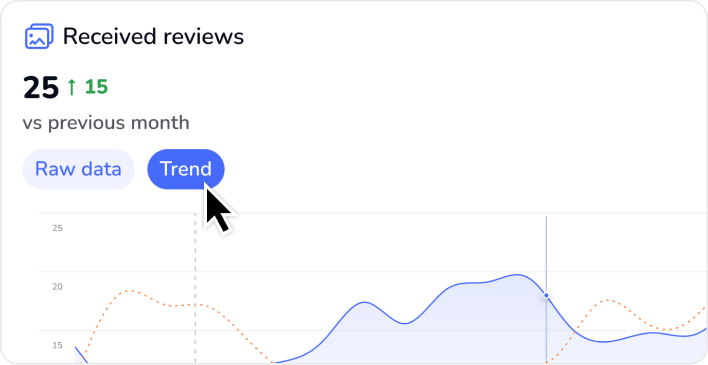
In need of detailed data? Use the raw view. Want to see the bigger picture? Switch to the trend view. This way, you can spot seasonal peaks and wider local tendencies.
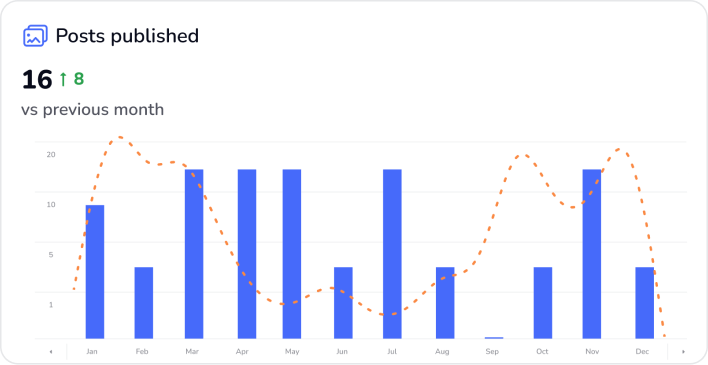
Cross-check customer activity against your own actions: published posts, photos, offers, and review responses. Now you know what worked best. And you can use it in the future.
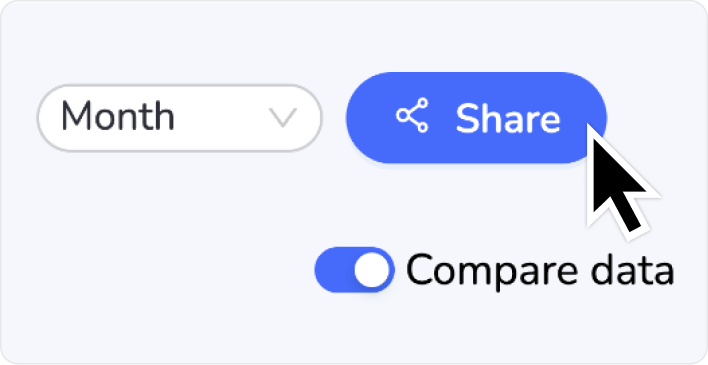
Click "Share" to create a white-label link with an overview of the results. It'll show your clients all the good work you've done for them.
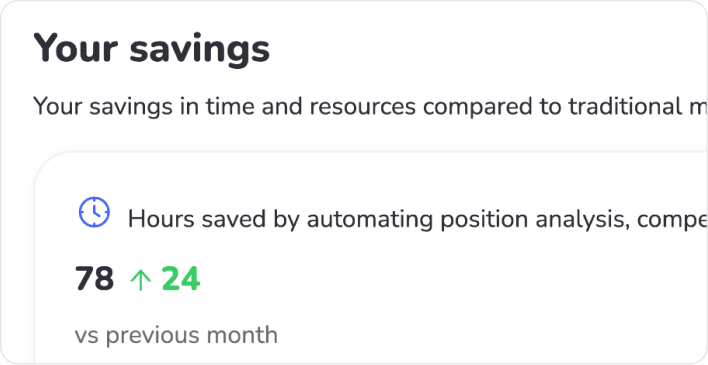
That little section at the end? It will tell you just how much time and money you saved on tedious marketing tasks and paid ads.
Statistics is just one part of our toolkit. See what else you can achieve when you put local SEO on autopilot.


Powered by Localo 2026