
Seventeen profile metrics get sold as local ranking factors: the Google Business Profile attributes supposed to correlate with where a business lands in the local pack. Localo, the local marketing platform specialists and agencies use to track and optimize client profiles at scale, tested every one of them against 16,098 Google Business Profiles, position by position. Every figure below describes profiles someone is actively working on.
Grouped studies, including our own analysis of 2 million Google Business Profiles, answer “what do the leaders do?” This one breaks the same question down position by position: what a page-one profile looks like, what a position #1 profile looks like, where each factor stops tracking with position, and the two boundaries where rankings drop abruptly rather than gradually. In that order: the eight factors that move with ranking, the three you can’t win on (two because nearly every profile already has them, one because Google won’t let you touch it), the keyword reality check, the tactics that don’t hold up, and where rankings break.
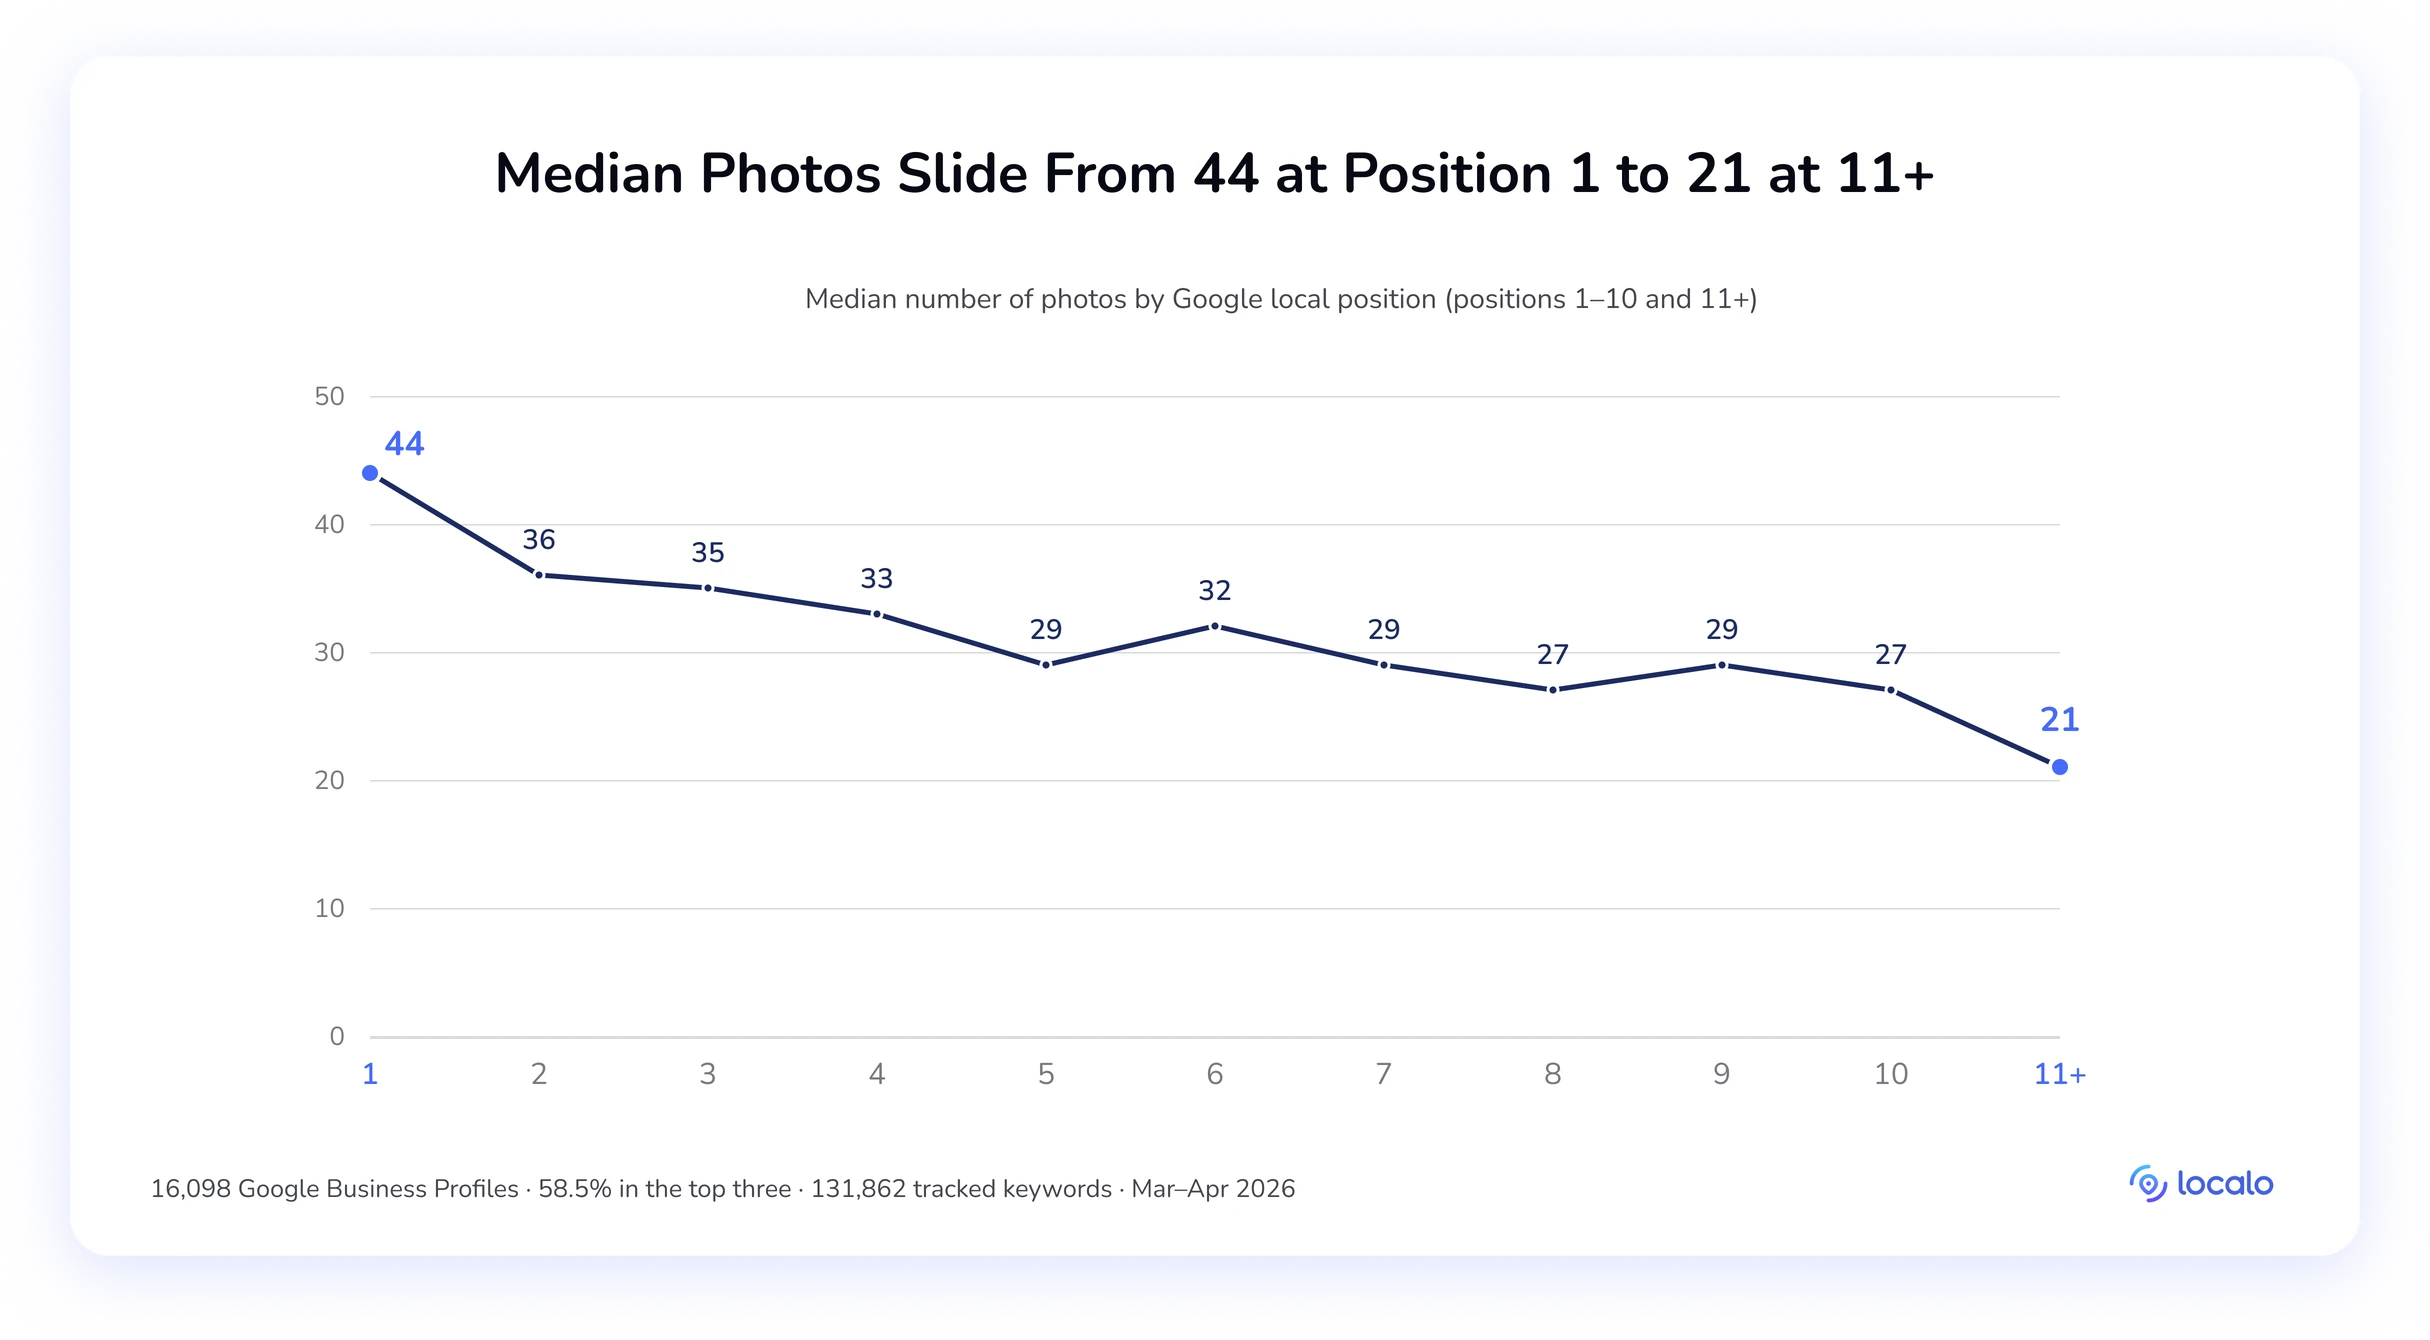
The short version: The median #1 profile has 79 reviews; at #11+ it’s 25. Photos separate #1 from #2 as sharply as reviews do: 44 versus 36, and they’re the half of that pair you don’t have to wait on customers to deliver. A perfect 5.0 rating ranks worse than a 4.9: 53.6% versus 69.1% top-three rate, what we call the 5.0 Paradox. Only 42.7% of #1 profiles meet all eight basic completeness criteria, against 17.2% at #11+. And review velocity, review length, reply rate, reply length, description length, and keywords in reviews produce no pattern a specialist can act on.
This is observational data, and position is influenced by much that a profile can’t capture: proximity, authority, live search context. Read the findings as “what top-ranking profiles look like,” not “what causes top rankings.”
The local search ranking factors that characterize top-ranking profiles
The Google Business Profile ranking factors that separate top-ranking profiles from the rest are listed below.
- Review count: Review count is the total published reviews on a profile, and it produces the widest spread of any factor we measured, from a 39.3% top-three rate at 1–5 reviews to 73.0% at 201–500.
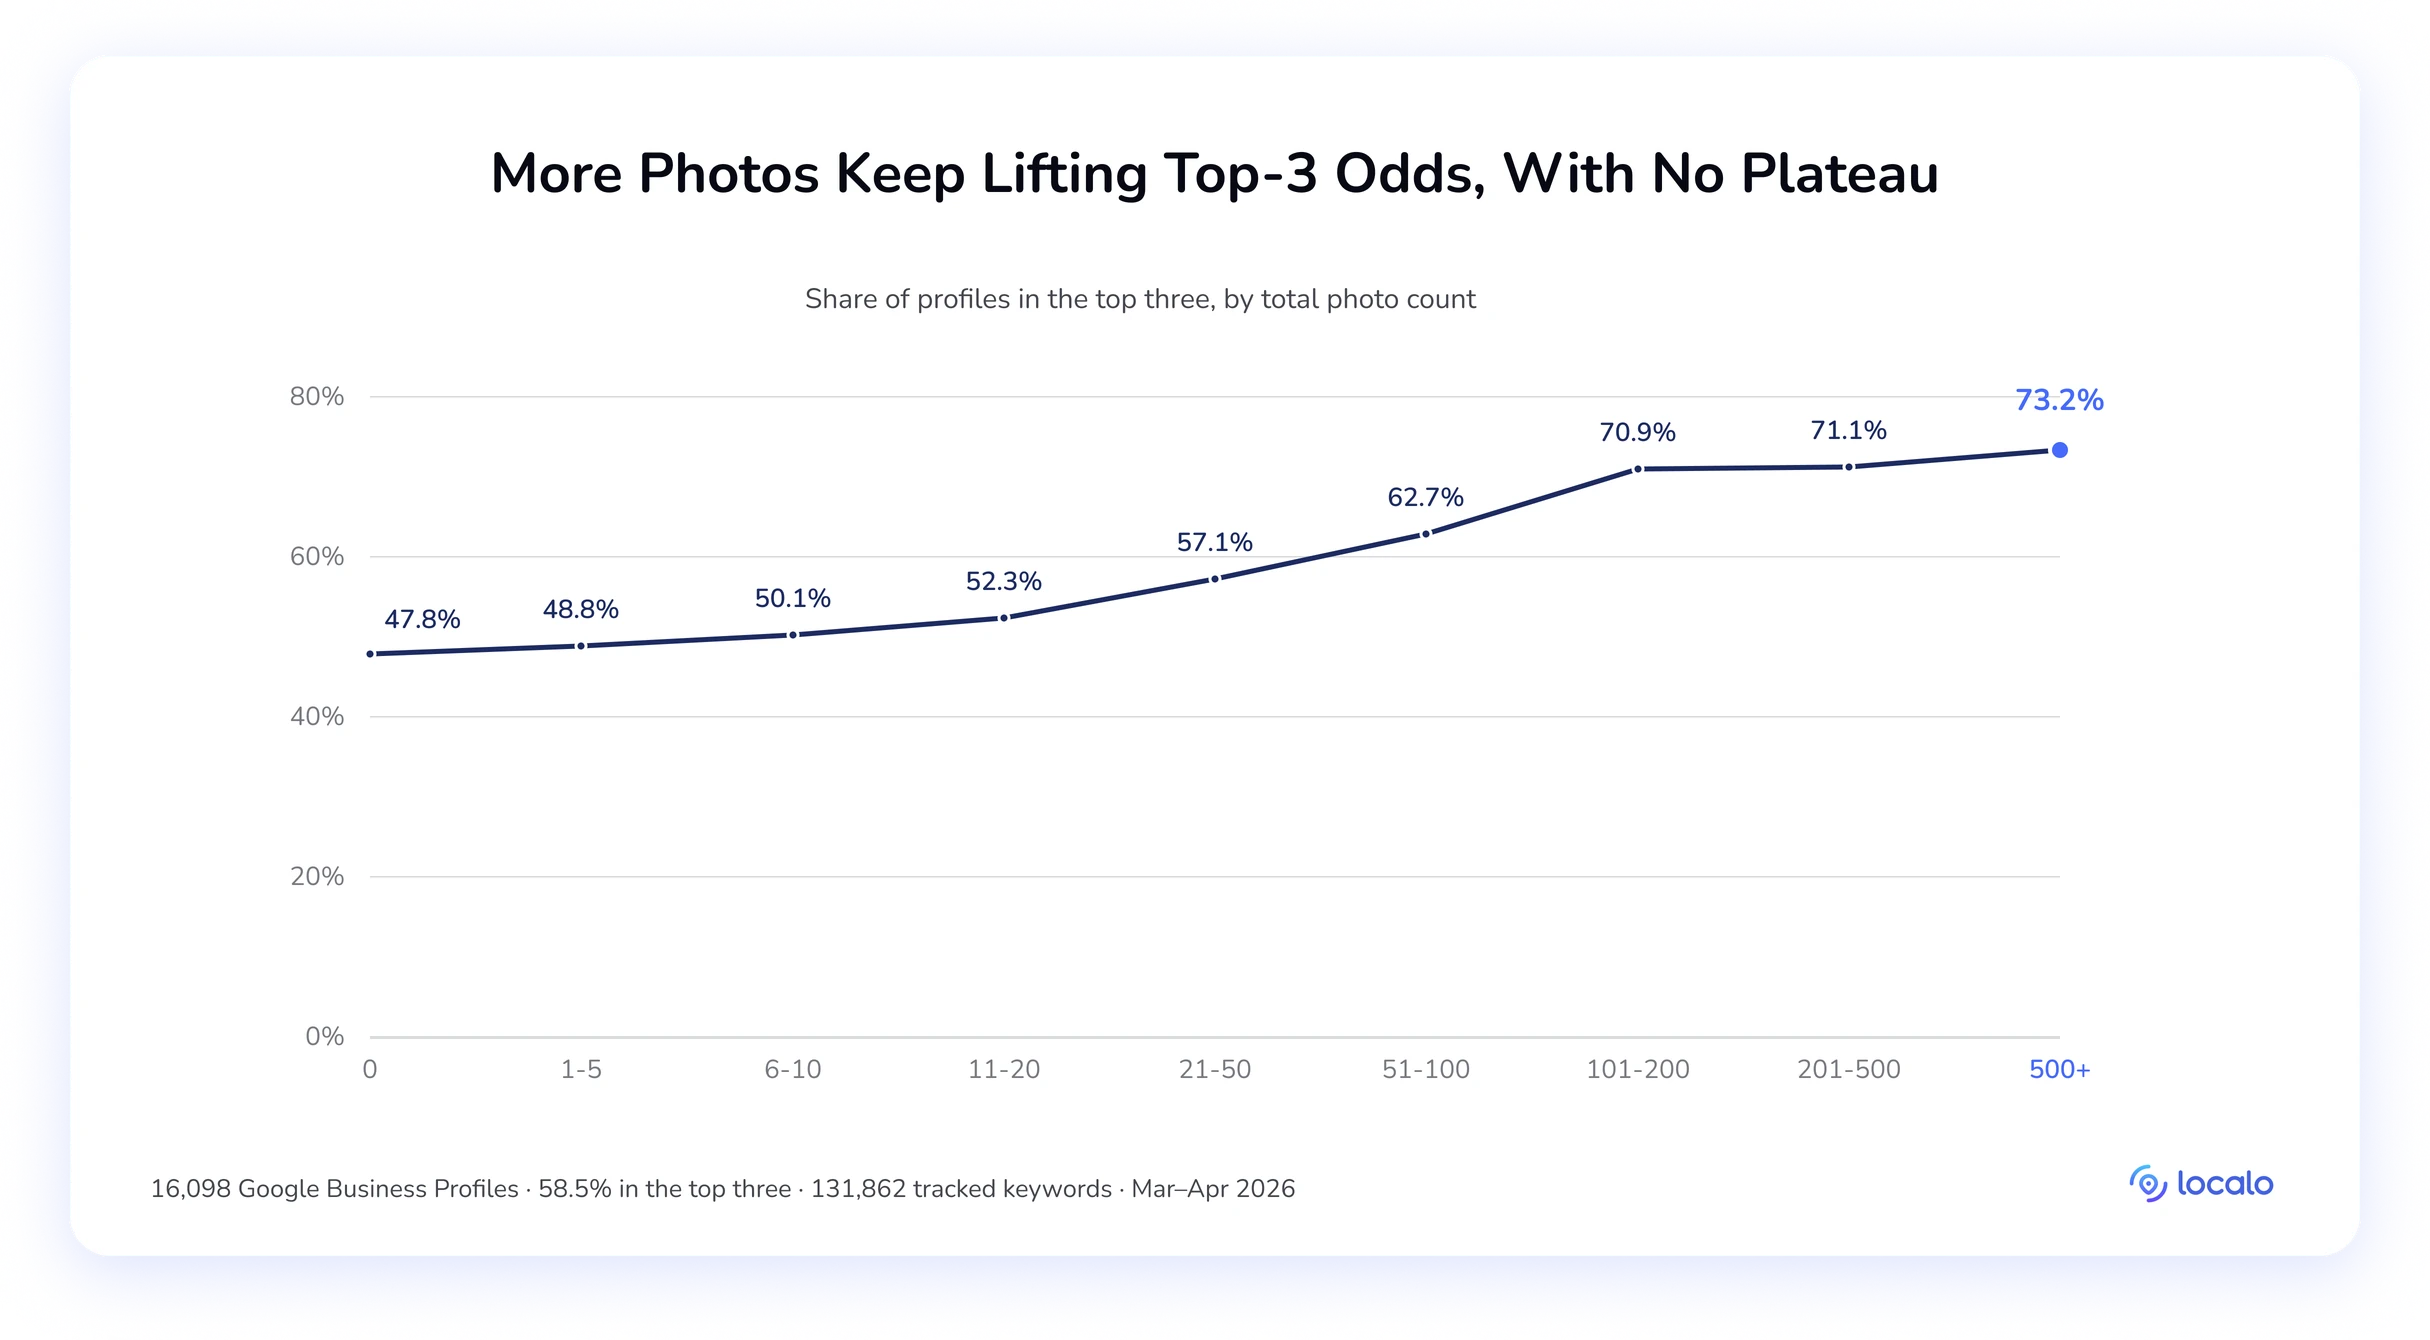
- Photos: Photo count is the number of images published to a profile, and it is the only factor with no measurable ceiling, still climbing at 500+ images.
- Ratings: Average rating is the mean star score across a profile’s reviews, and it is the flattest line in the study, with a perfect 5.0 ranking worse than a 4.9.
- Business description: The business description is the profile’s free-text summary, and its value compounds with review count, worth +10.8pp at ten reviews or fewer and +25.8pp at 200+.
- Additional categories: Additional categories are the secondary classifications beyond a profile’s primary category, and six of them show the highest top-three rate at 69.1%.
- Citations: Citations are mentions of a business’s name, address, and phone number across external directories, and their payoff front-loads, then stops at roughly 21–27.
- Social media links: Social media links are the platform profiles connected to a Google Business Profile, and they pay up to about five links, with Facebook the strongest single addition at +13.2pp.
- Google posts: Google posts are the short updates published to a profile, and publishing at all is worth +7.1pp while nothing inside posting matters.
1. Review count
Google confirms that reviews influence local prominence, and our data agrees: review count is the strongest single signal we measured. What matters for a client conversation is how many a profile actually needs. So we calculated averages and medians for GBPs in positions #1–20, in three groups.
| Position groups | 1–3 | 4–10 | 11–20 |
|---|---|---|---|
| Average reviews | 348 | 303 | 156 |
| Median | 74 | 44 | 30 |
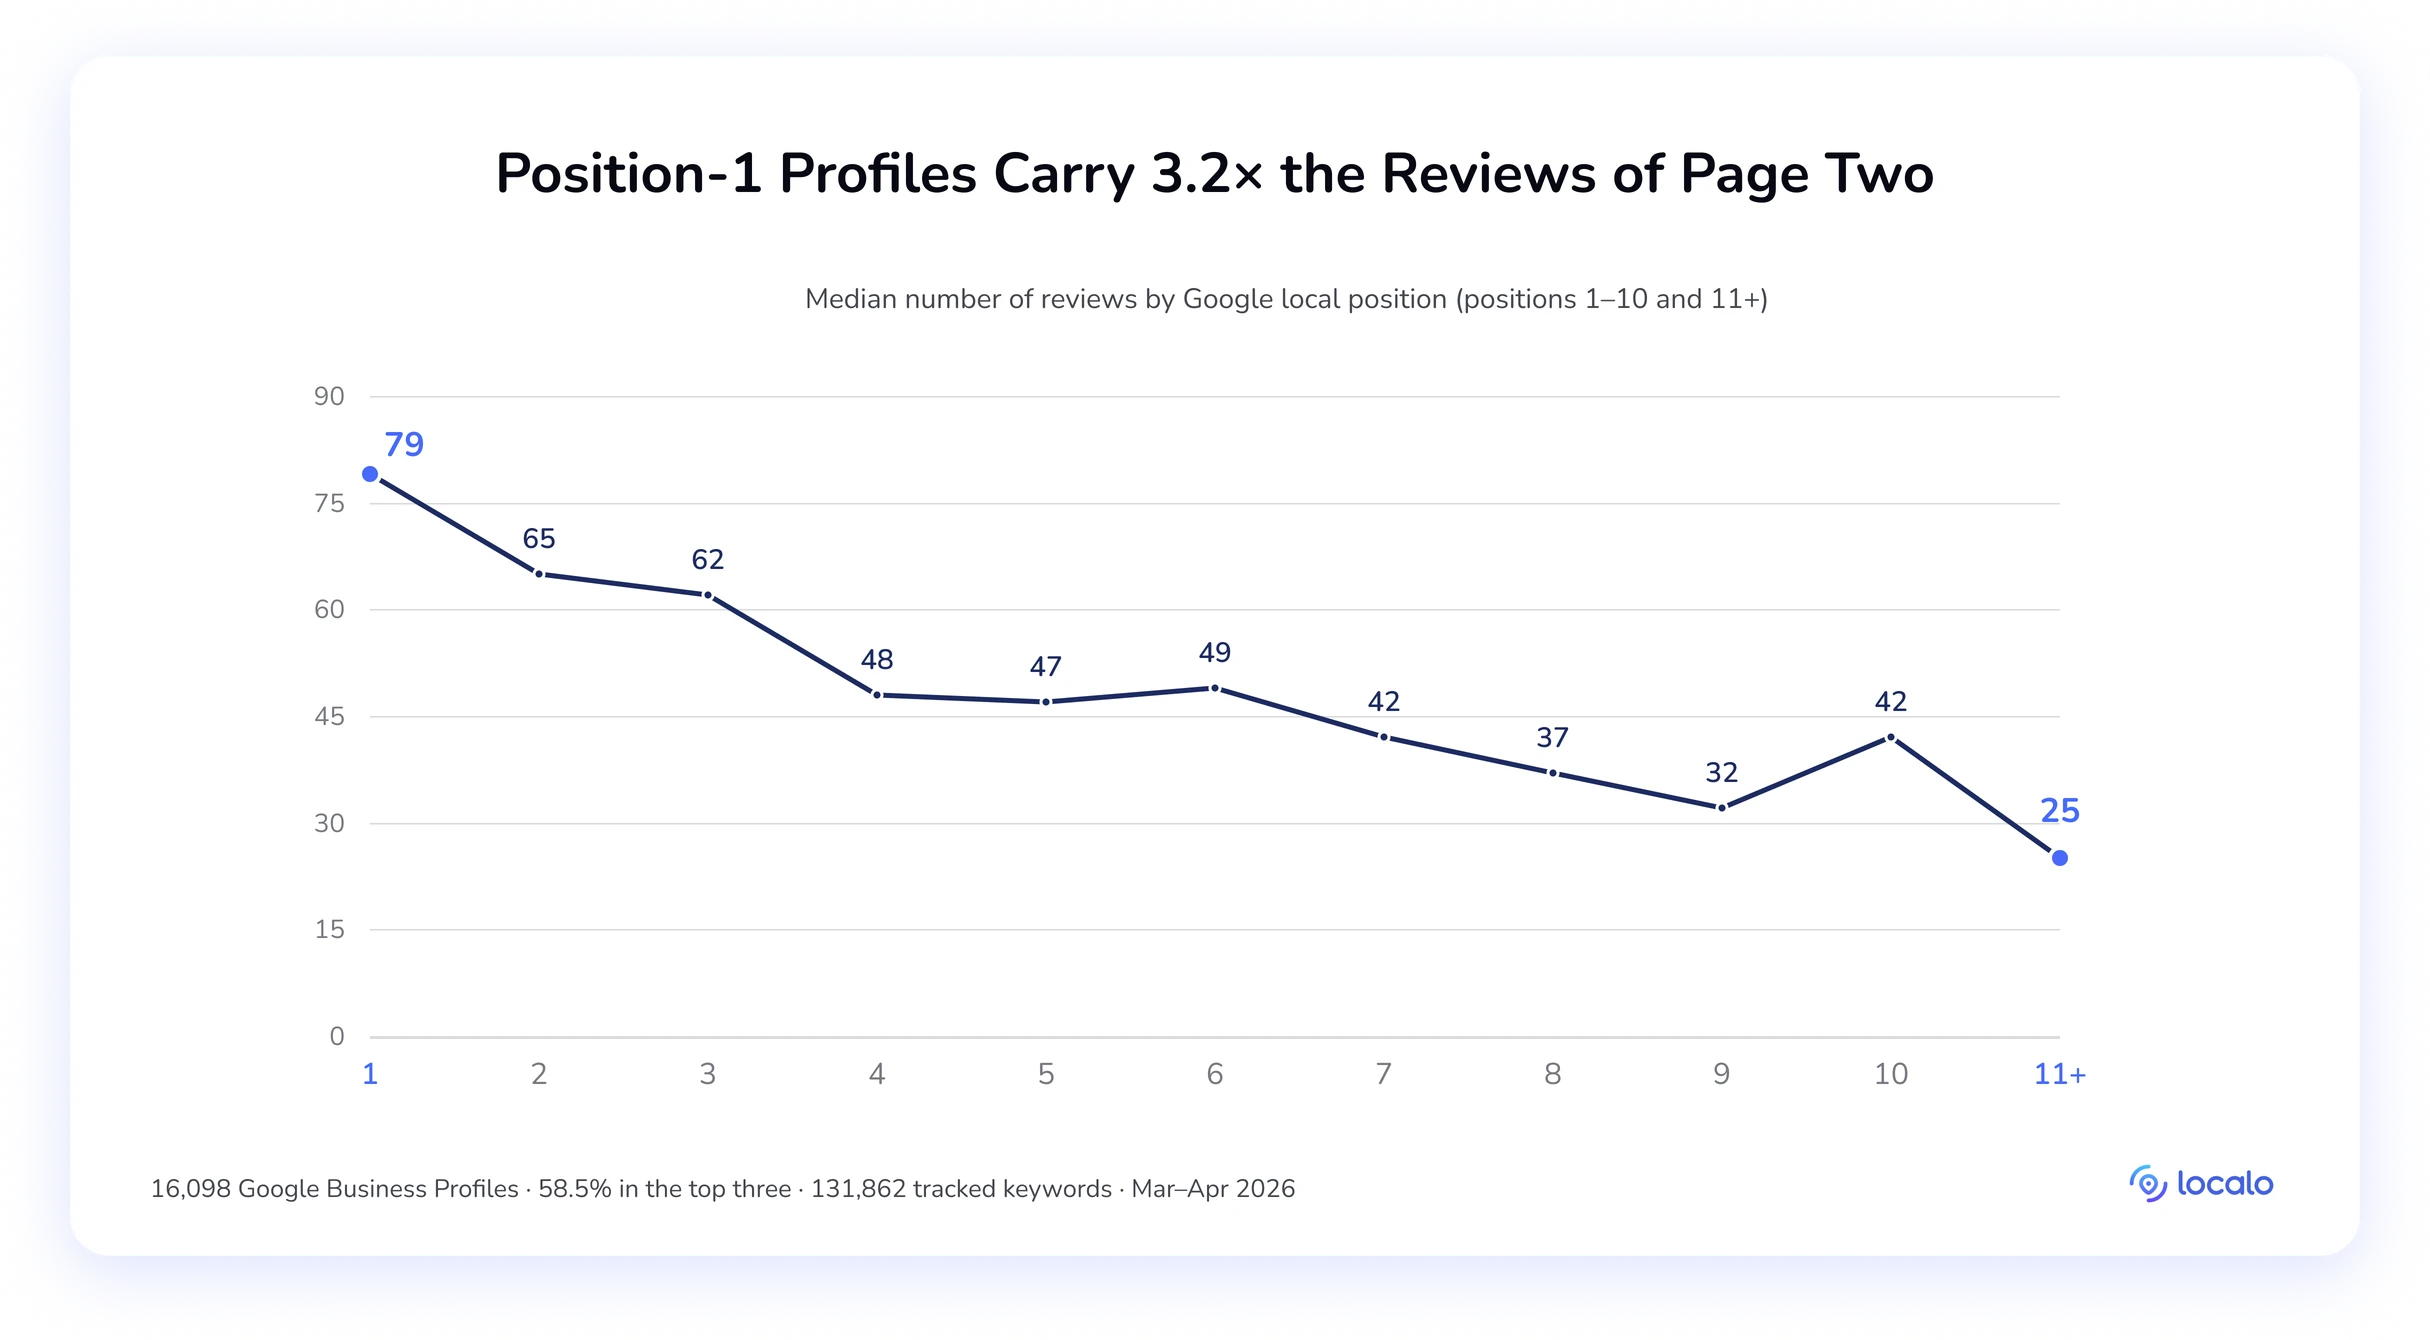
Position by position, the median is 79 reviews at position #1, 65 at #2, and 25 at #11+, and #1 holds 3.2× the reviews of the bottom group.
Moving a client from #2 to #1 takes roughly a fifth more reviews, a 14-review step, matched exactly by dropping from #3 to #4, where the median falls from 62 to 48. Between #4 and #10 the curve stops behaving like a ladder, wobbling between 32 and 49 reviews, with #9 (32) sitting well below #10 (42), so reviews alone don’t decide where a profile lands inside page one. The steepest drop is at the page boundary: 42 reviews at #10 against 25 at #11+.
Bracketed by review count, the biggest sustained jump is crossing 10 reviews: 43.1% of profiles with 6–10 reviews rank top-three, against 50.8% at 11–20 reviews. From there it climbs to 57.1% (21–50) and 64.5% (51–100) before the top-performer cluster at 68.9% (101–200). The curve peaks at 73.0% (201–500), then slips back to 70.7% above 500, so the gains run out somewhere in the low hundreds.
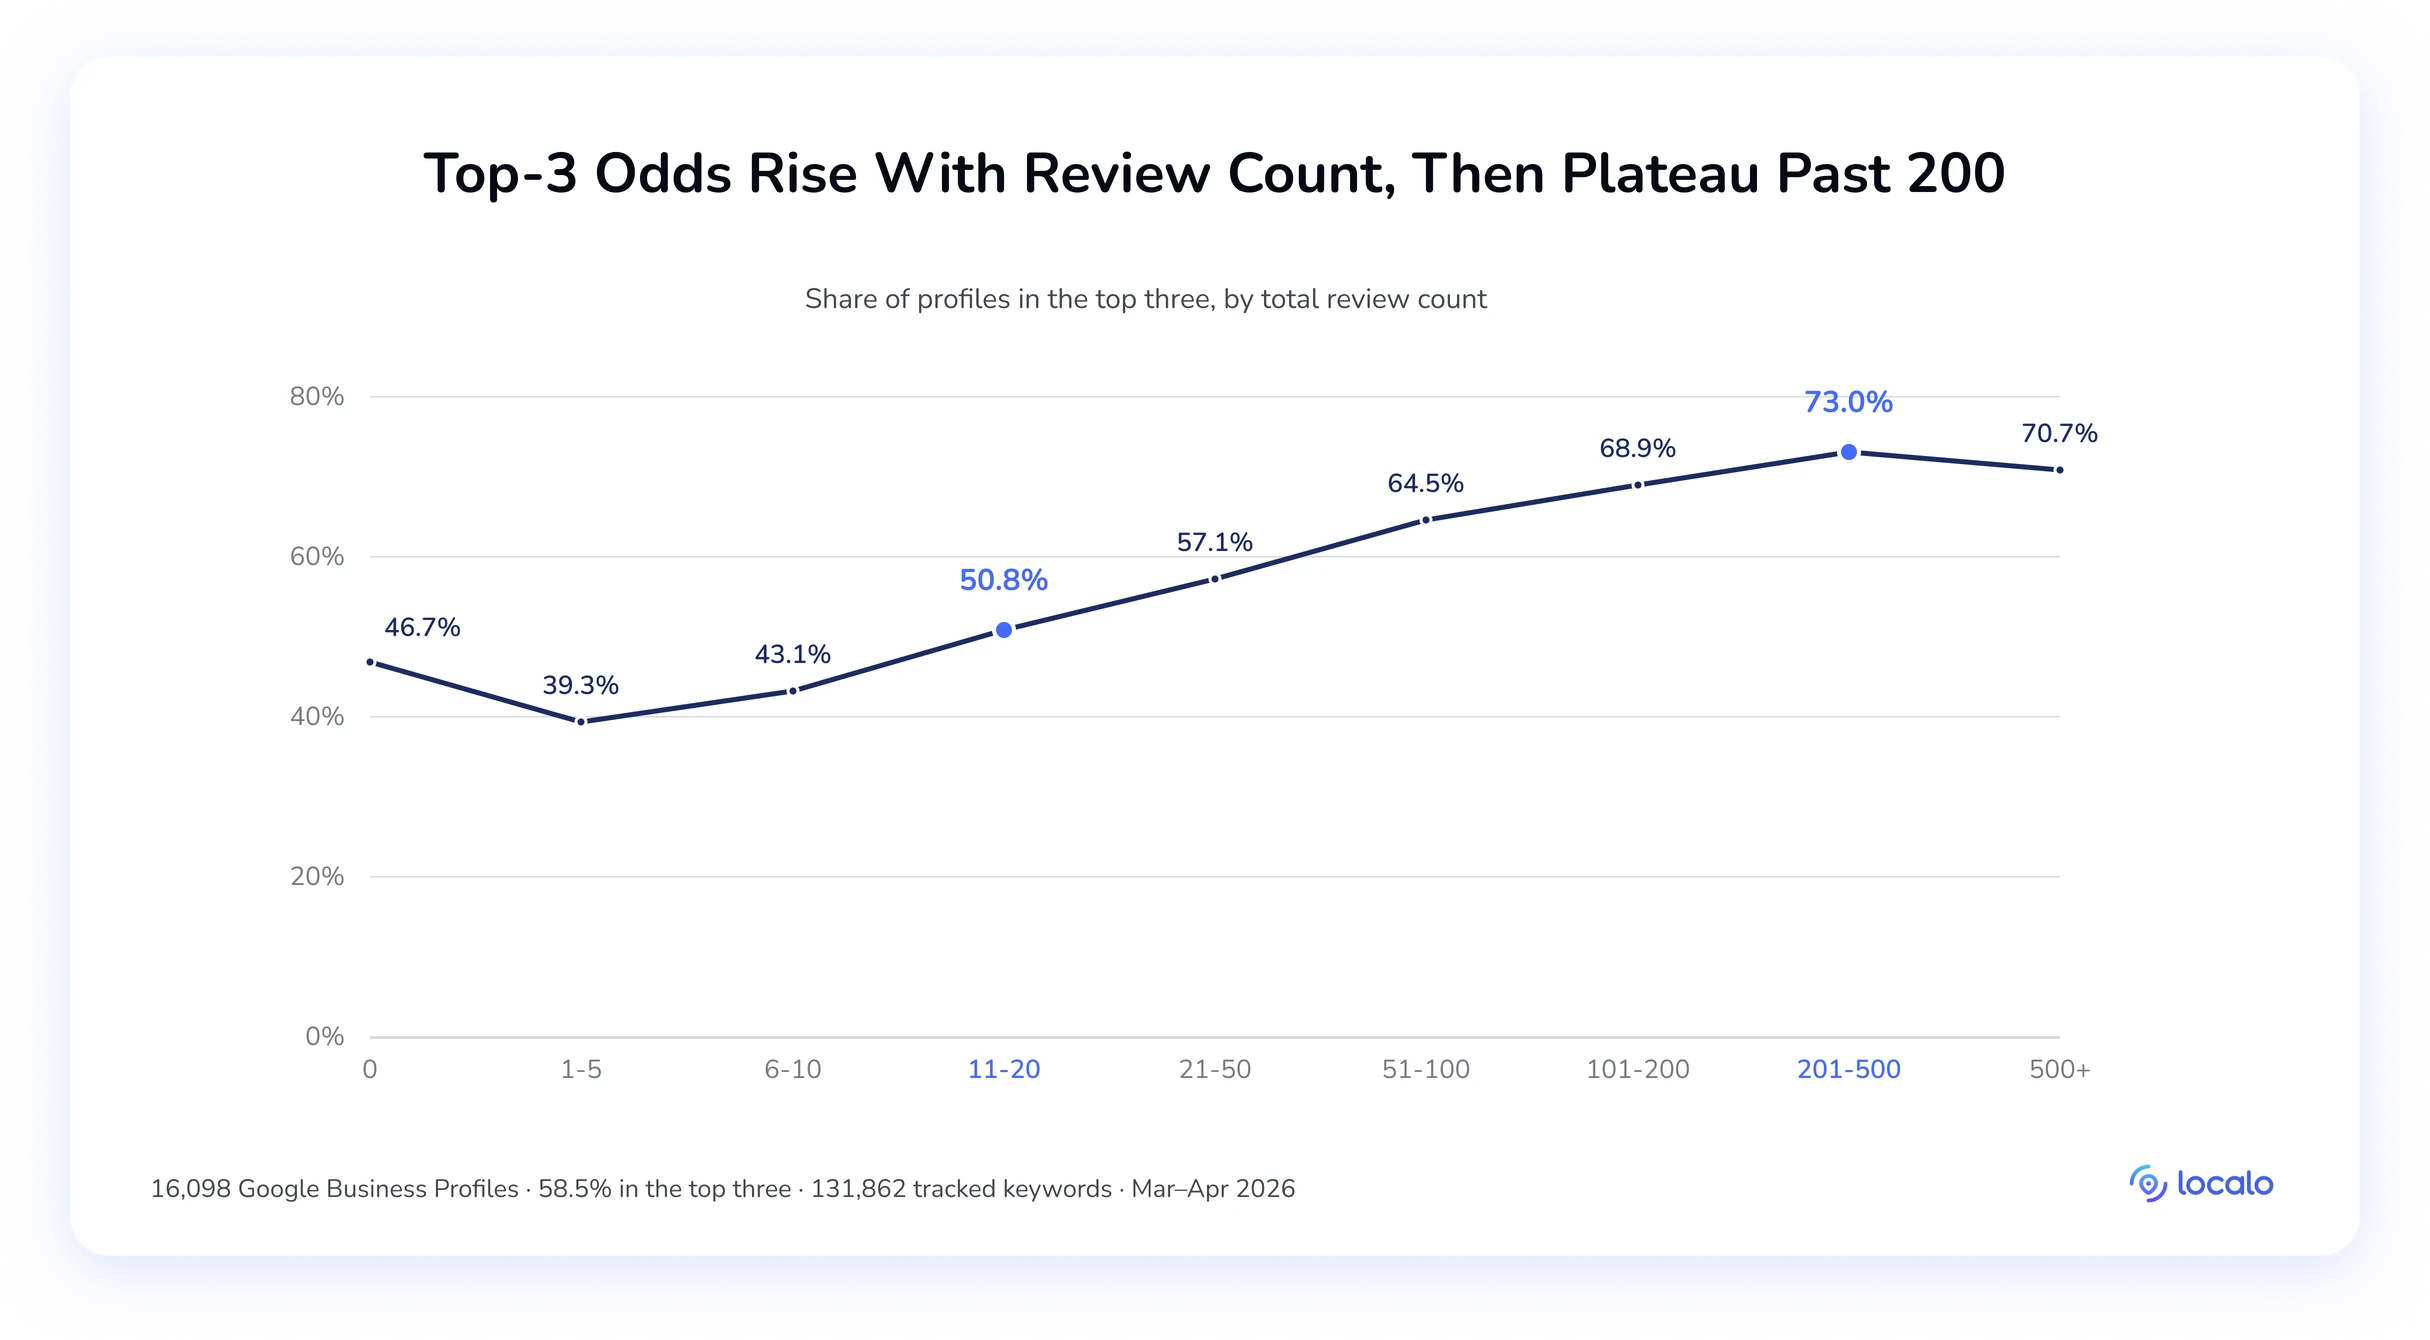
Is it possible to rank in the top 3 with zero reviews? The data shows it is, as businesses with no reviews have a 46.7% top-3 rate. However, these are mostly companies operating in super-low-competition niches. That’s why the top-3 rate drops to 39.3% for companies with 1–5 reviews; they likely do have competitors, and that’s why they need more reviews to rank higher.
🔎 Key takeaway:
Two numbers to hold onto: 25 is the median at #11+, so below that a profile is mostly off page one, and 100 is where top performers cluster. Between those, review count keeps tracking with position. Past a few hundred, it stops. Keep review management running because deletions can quietly pull a profile back under the floor.
2. Photos
Photos look like the strongest mover you don’t have to wait on customers to deliver. Unlike reviews, adding pictures to a Google Business Profile is a task you or your client can complete on demand, and it’s the only factor in our data with no ceiling.
Top-three profiles run a median of 41 photos against 24 at #11–20, and 26.8% of them have uploaded 100+.
| Position groups | 1–3 | 4–10 | 11–20 |
|---|---|---|---|
| Average number of photos | 102 | 74 | 62 |
| Median | 41 | 29 | 24 |
Position by position, the decline is close to steady: 44 photos at #1, 36 at #2, 35 at #3, then a slow slide to 27 at #10 and 21 at #11+, and #1 carries just over double the bottom group. The median drop from #1 to #2 is the one that matters: 18.2% (from 44 to 36). It’s the steepest step from #1 to #2 of any metric we measured, just ahead of reviews at 17.7%.
If reviews track with getting into the top three, photos track with the ordering inside it.
Compared with every other factor we measured, photos have one unique property: no plateau. The top-three rate climbs from 47.8% at zero photos to 62.7% at 51–100, 70.9% at 101–200, and 73.2% past 500. Reviews flatten after 200, but photos just keep generating value.
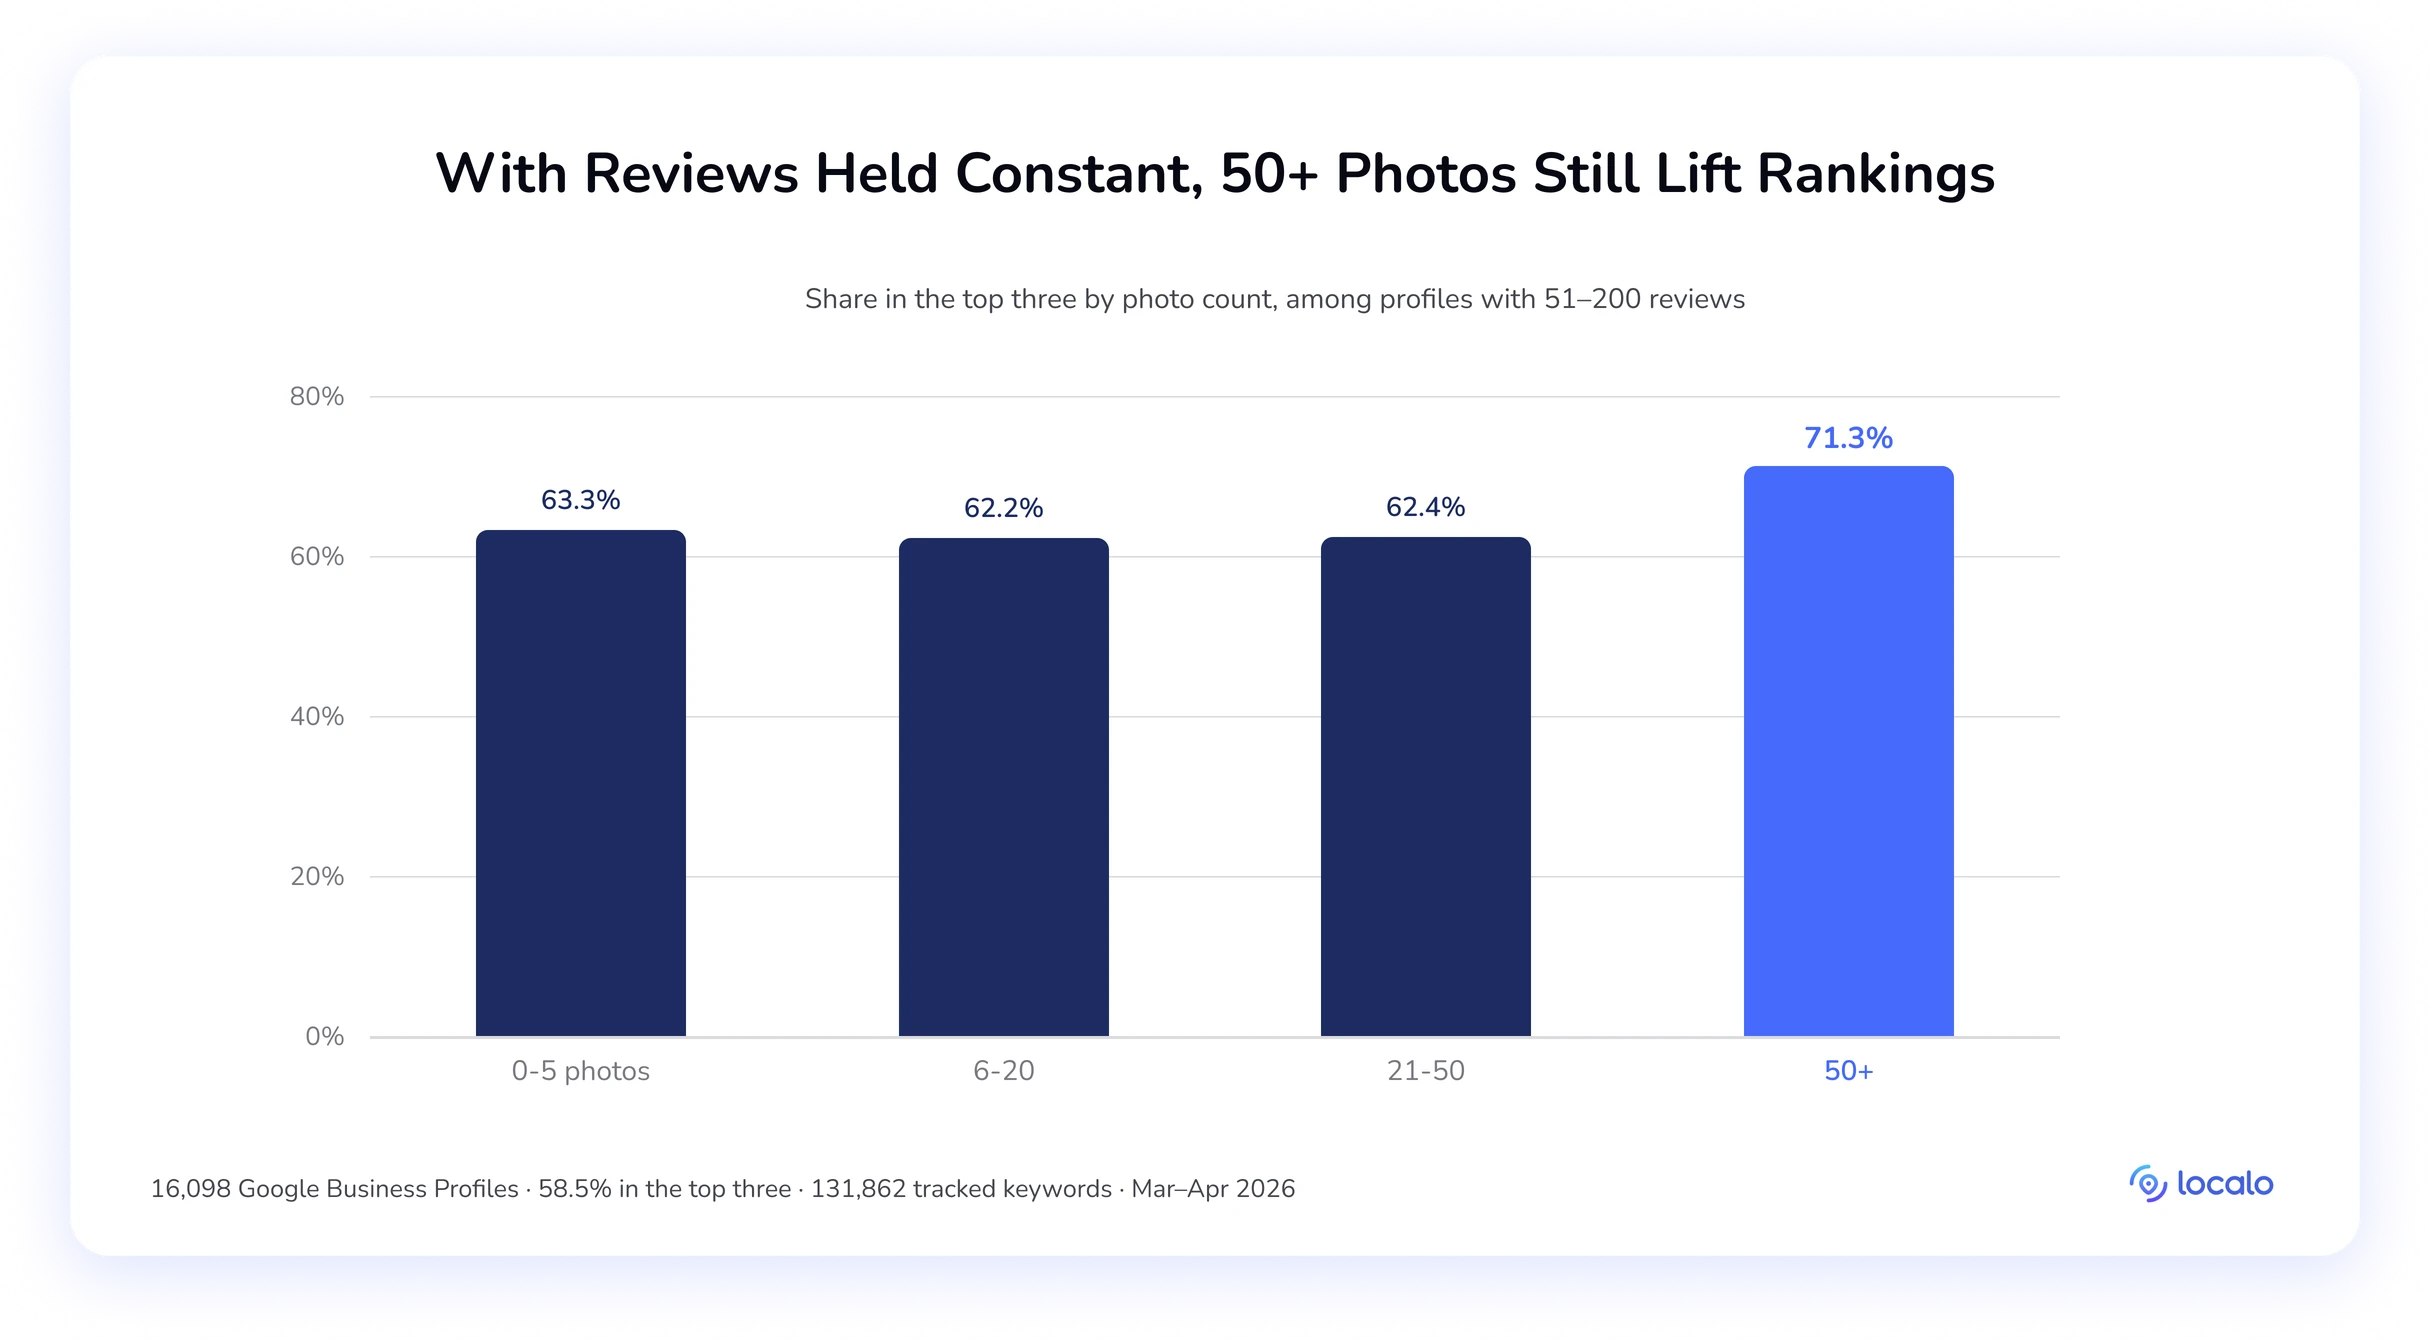
When we controlled our data for review volume to see how photos affect GBPs with 51–200 reviews, the pattern holds: profiles with more photos rank better.
Businesses with over 50 profile photos have a 71.3% top-3 rate against 62.4% for the 21–50 bracket and 62.2–63.3% across all the lower brackets, a 9pp advantage from photos alone, with review count held constant.
🔎 Key takeaway:
Photos are the only factor in our data with no ceiling, and they carry the widest #1-to-#2 gap of any metric. Aim for 40+: the #1 median is 44 and #2–3 sit at 35–36, so clearing 40 puts a profile in genuine contention for the top spot.
Photos also ask the least of the client: nobody has to wait for a customer to feel like publishing something. Say exactly that when you ask for the next batch.
3. Ratings
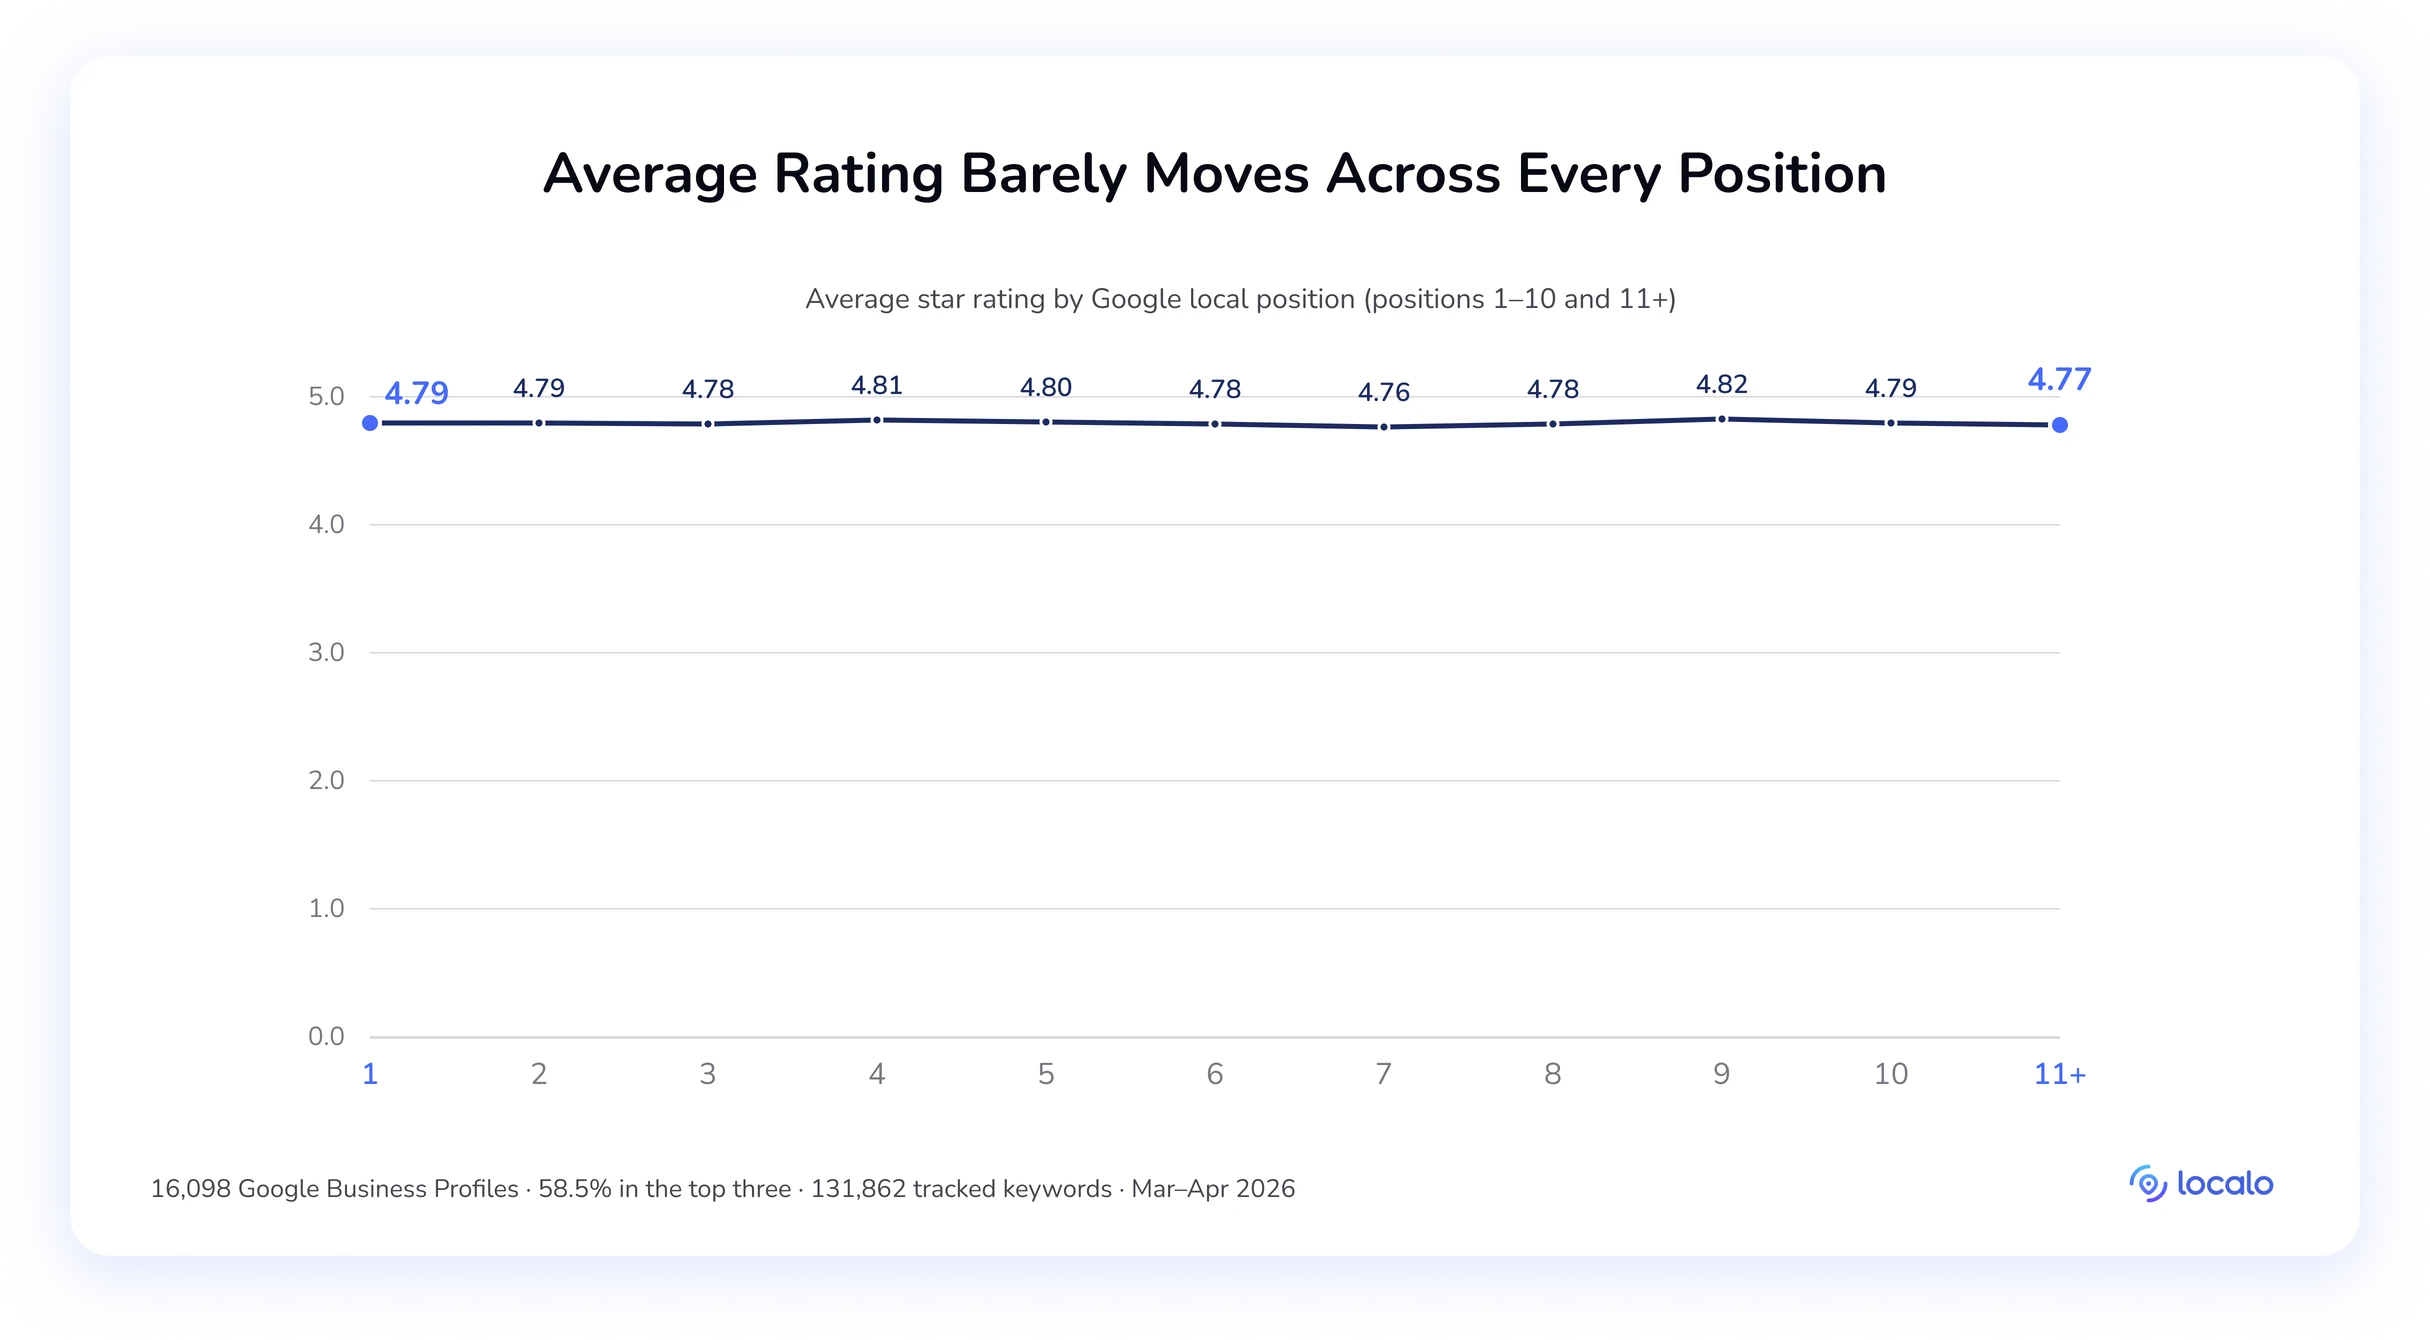
Every client wants a perfect 5.0, and almost nothing about that instinct survives contact with the data. Start with the average rating, the flattest line in the entire study: 4.76 to 4.82 across all position groups, a spread of 0.06 points. It is not a differentiator. You can stop reporting it to clients as progress.
Two things about ratings do matter, and they point in opposite directions: a soft floor around 4.5, and a reversal at the very top that we call the 5.0 Paradox; profiles with a perfect score rank worse than profiles at 4.9.
| Position groups | 1–3 | 4–10 | 11–20 |
|---|---|---|---|
| Average rating | 4.79 | 4.79 | 4.78 |
| % of 5.0-star GBPs | 36.9% | 43.6% | 45.2% |
The floor first. 84.4% of #1 profiles sit at 4.5 or above, against 74.7% at #11+, a 9.7-point gap the flat average hides completely. Treat it as where the top of the market clusters rather than a gate: three-quarters of #11+ profiles clear 4.5 too, so missing it doesn’t disqualify a profile; it just puts it in thinner company.
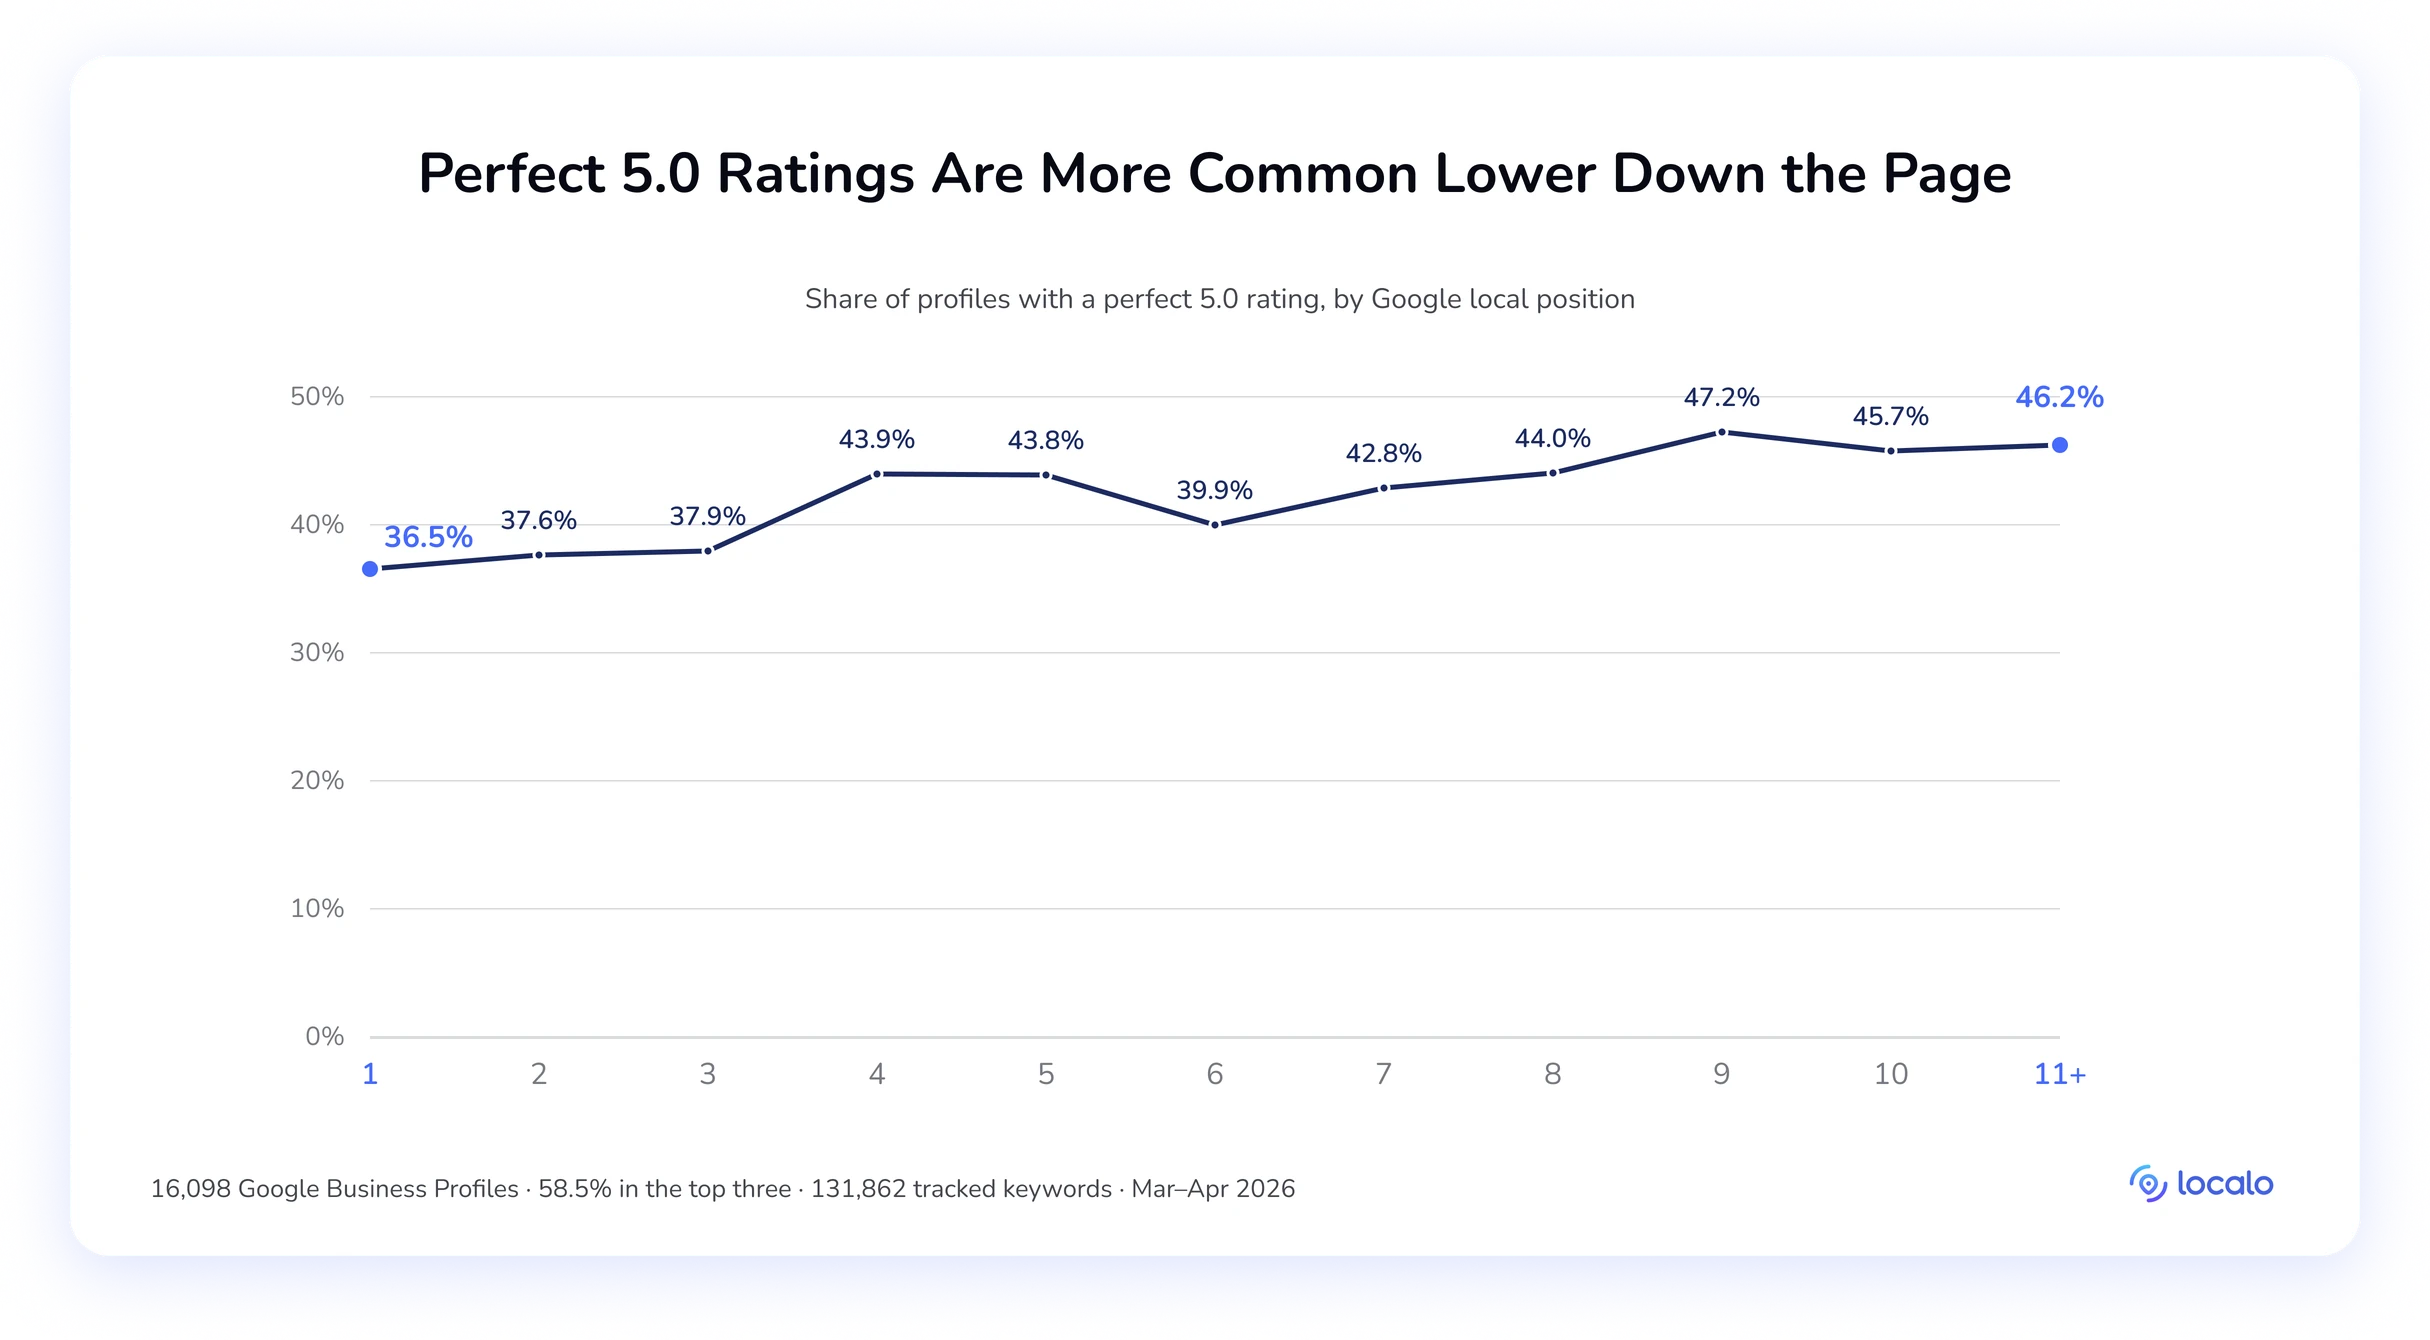
The reversal holds at the group level and at both endpoints: 36.5% of #1 profiles hold a perfect 5.0, rising to 43.9% by #4 and 46.2% at #11+. The climb isn’t clean. It dips back to 39.9% at #6 and tops out at 47.2% at #9, but the direction is unmistakable. It’s the only one of the eight movers that runs backward like this, though reply rate and reply length do the same thing, which the busted-tactics section covers.
Sorting profiles by star rating shows what the reversal costs. Top-three performance climbs steadily to a peak at 4.9, where 69.1% of profiles rank in the top three. Then it drops to 53.6% at a perfect 5.0. Controlling for review volume shows the rating was never the problem: profiles that hold a 5.0 and have 200+ reviews reach a 76.8% top-3 rate, well above the 69.1% peak for 4.9-rated profiles. A perfect score isn’t a liability. A perfect score with fifteen reviews is.
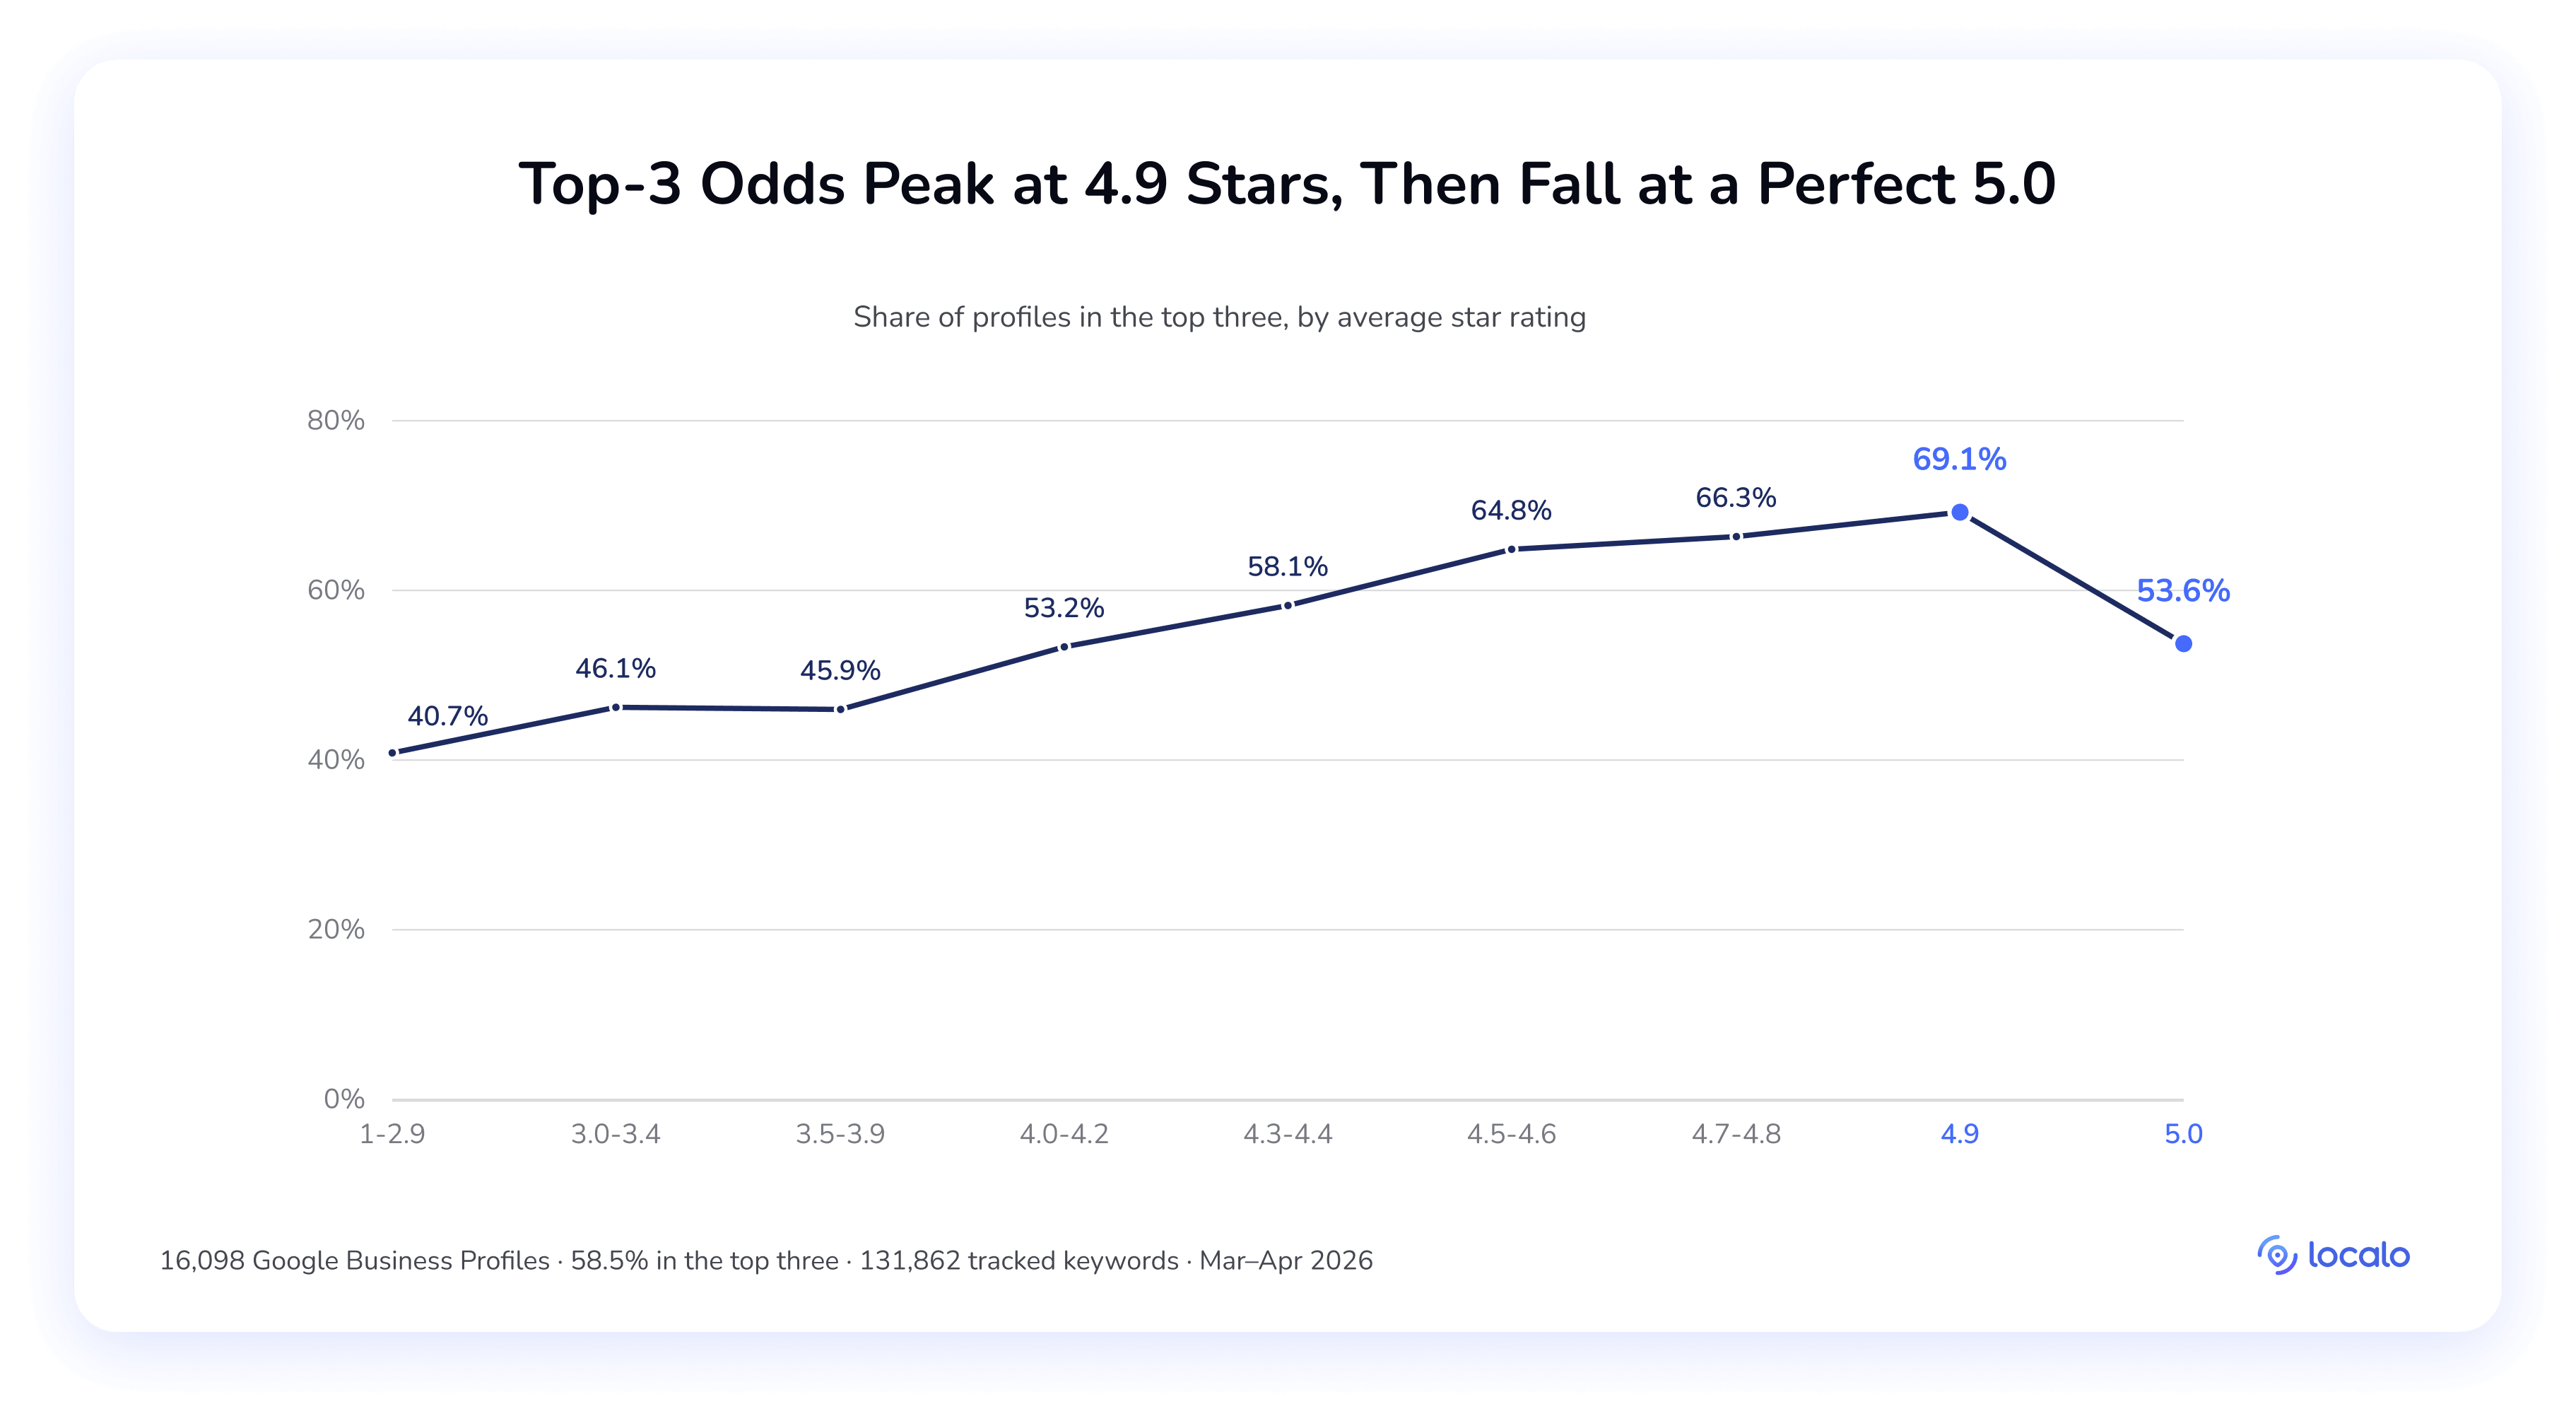
Ratings below 4.5 slide rather than collapse: 4.3–4.4 profiles still rank top-3 58.1% of the time and 4.0–4.2 manage 53.2%, with the rate only dropping under 50.0% below 4.0. The sweet spot is 4.7–4.9: 66.3% at 4.7–4.8 and 69.1% at 4.9, against 64.8% at 4.5–4.6, high enough for credibility, low enough to signal real volume.
🔎 Key takeaway:
When a client panics over one bad review, this is the section to show them: a 5.0 usually means there aren’t enough reviews to compete, so the review that costs them the perfect score is the one that signals volume. The rare client holding 5.0 past 200 reviews posts the strongest reading of any controlled cut we ran. The rating that actually matters is any below 4.5.
4. Business description
The description is the most underrated metric in our data, not because presence is rare, but because its value scales with everything else you’re doing. Nearly every profile in positions #1–20 has one, so the question isn’t whether to write it, but who gains most from having it.
| Position groups | 1–3 | 4–10 | 11–20 |
|---|---|---|---|
| Description rate | 95.7% | 93.8% | 91.2% |
Presence is nearly universal, which is why the grouped gap is only 4.5 points. Position by position, the slide inside page one is gentle: 95.7% at each of the top three, easing to 92.2% at #10, about four-tenths of a point per position. Then the page boundary does the real work: 89.2% at #11+, a 3-point drop in a single step, nearly as much as the entire slide across page one. That’s a factor that separates page one from page two, leaving the gap to the top three at 6.5 points.
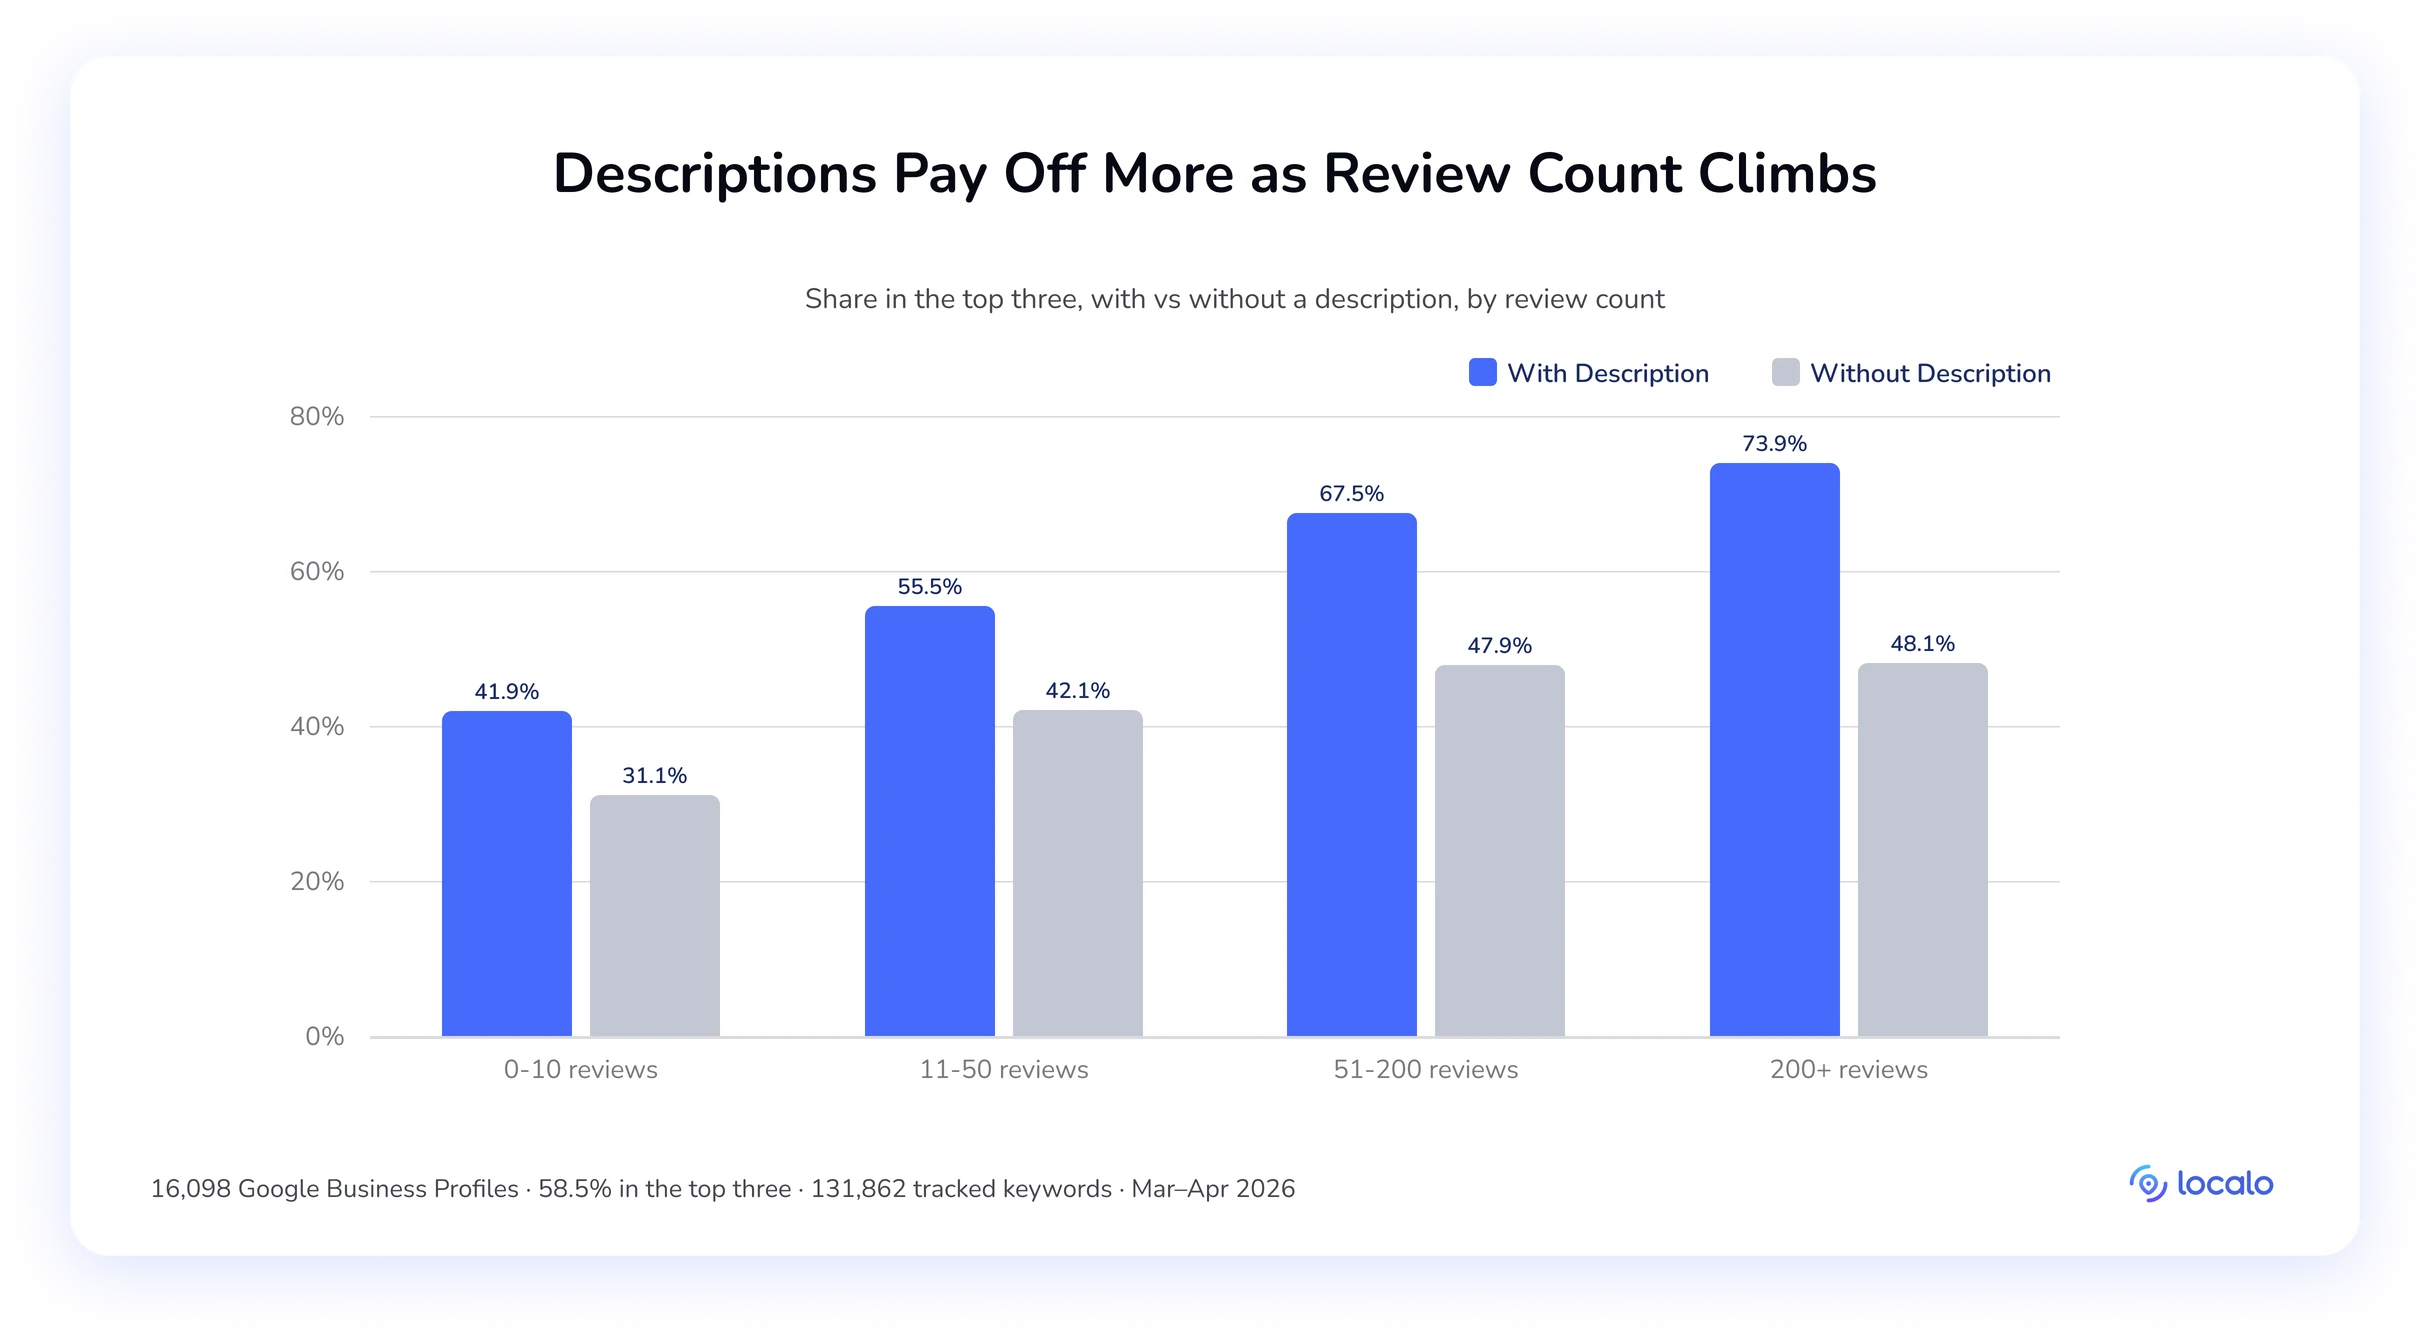
The interesting part is who benefits. Controlling for review count, a description’s value climbs with everything else on the profile. At ten reviews or fewer, a description is worth +10.8pp. At 200+ it’s worth +25.8pp. And look at the “without” column: it stops moving past 51 reviews, 47.9% to 48.1%. Without a description, reviews stop paying past about fifty. That’s the compounding: the description isn’t a checkbox, but what lets the rest of your work register.
🔎 Key takeaway:
Descriptions compound: worth +10.8pp on a profile with ten reviews or fewer, +25.8pp on one with 200+. The action is binary: every profile you manage either has one, or it doesn’t, so write it once, and skip revisits for optimization unless accuracy is an issue.
5. Additional categories
Adding secondary business categories is an important part of a full local SEO audit.
| Position groups | 1–3 | 4–10 | 11–20 |
|---|---|---|---|
| Average additional categories | 3.59 | 3.08 | 2.81 |
| % of businesses with no additional categories | 18.0% | 24.2% | 26.9% |
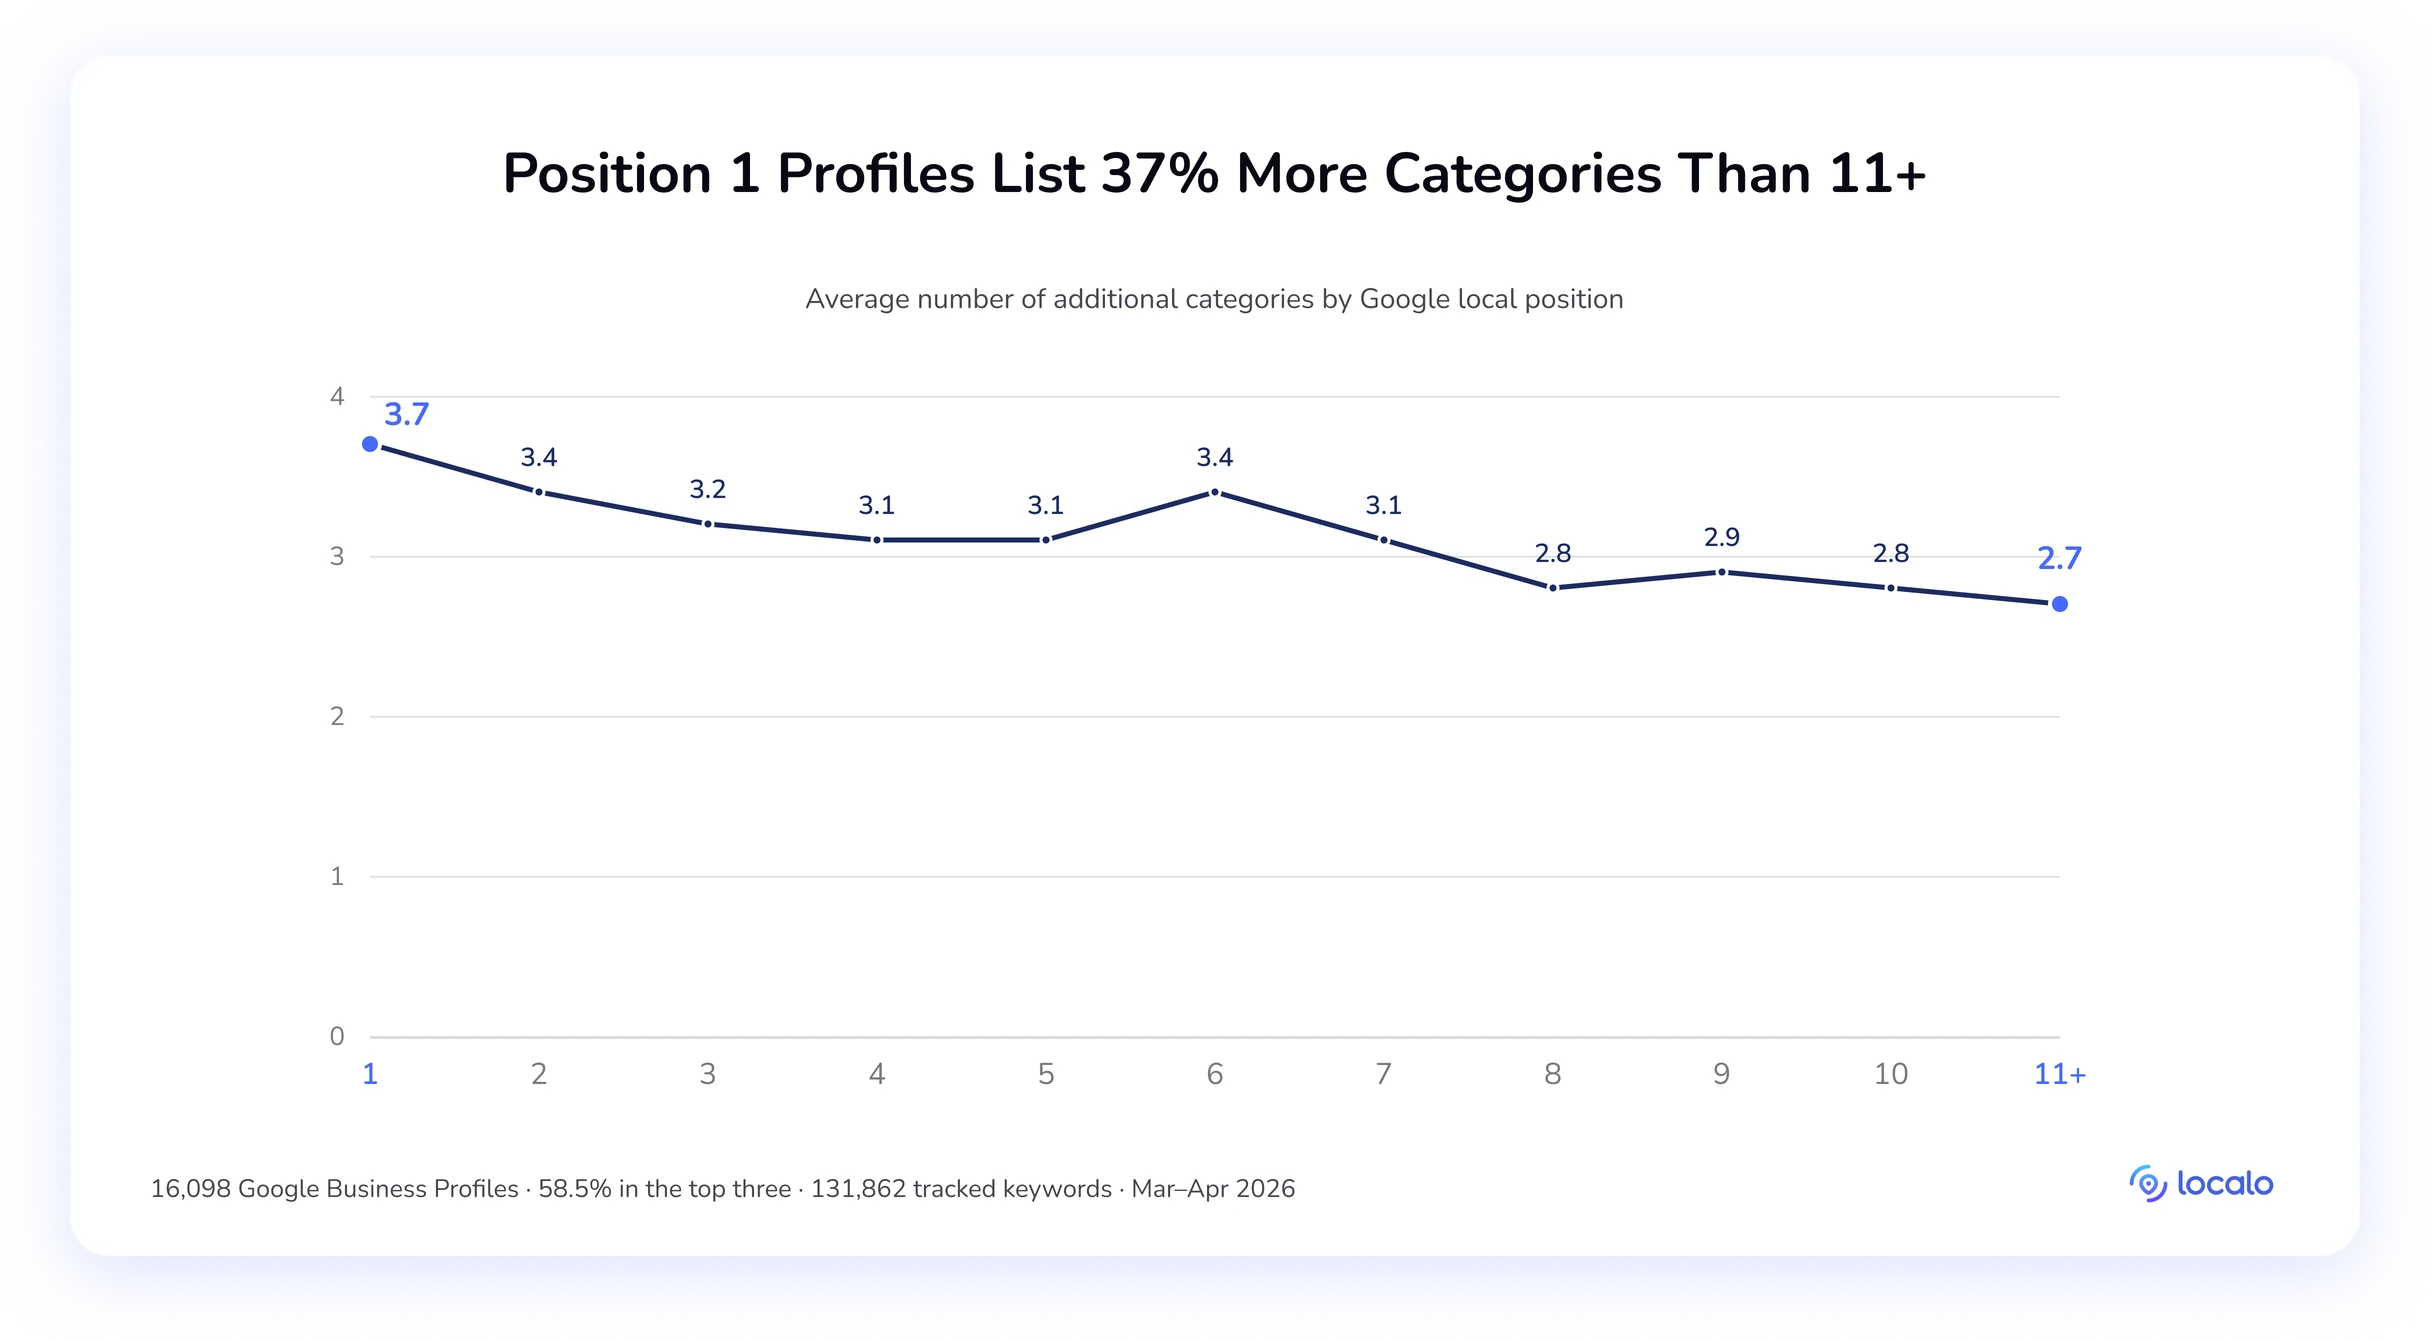
Position by position, 3.7 categories at #1, 3.4 at #2, a band between 2.8 and 3.4 from #4 through #10, and 2.7 at #11+, so 37.0% more categories at the top than at the bottom. The #1-to- #2 step drops 0.3 of a category, the largest drop this metric shows, though it ties with #6-to-#7 and #7-to-#8.
Small in absolute terms, which is what makes one well-chosen category addition worth testing on a profile already sitting at #2. Zero categories is the real red flag, and a quarter of profiles at #11–20 have none.
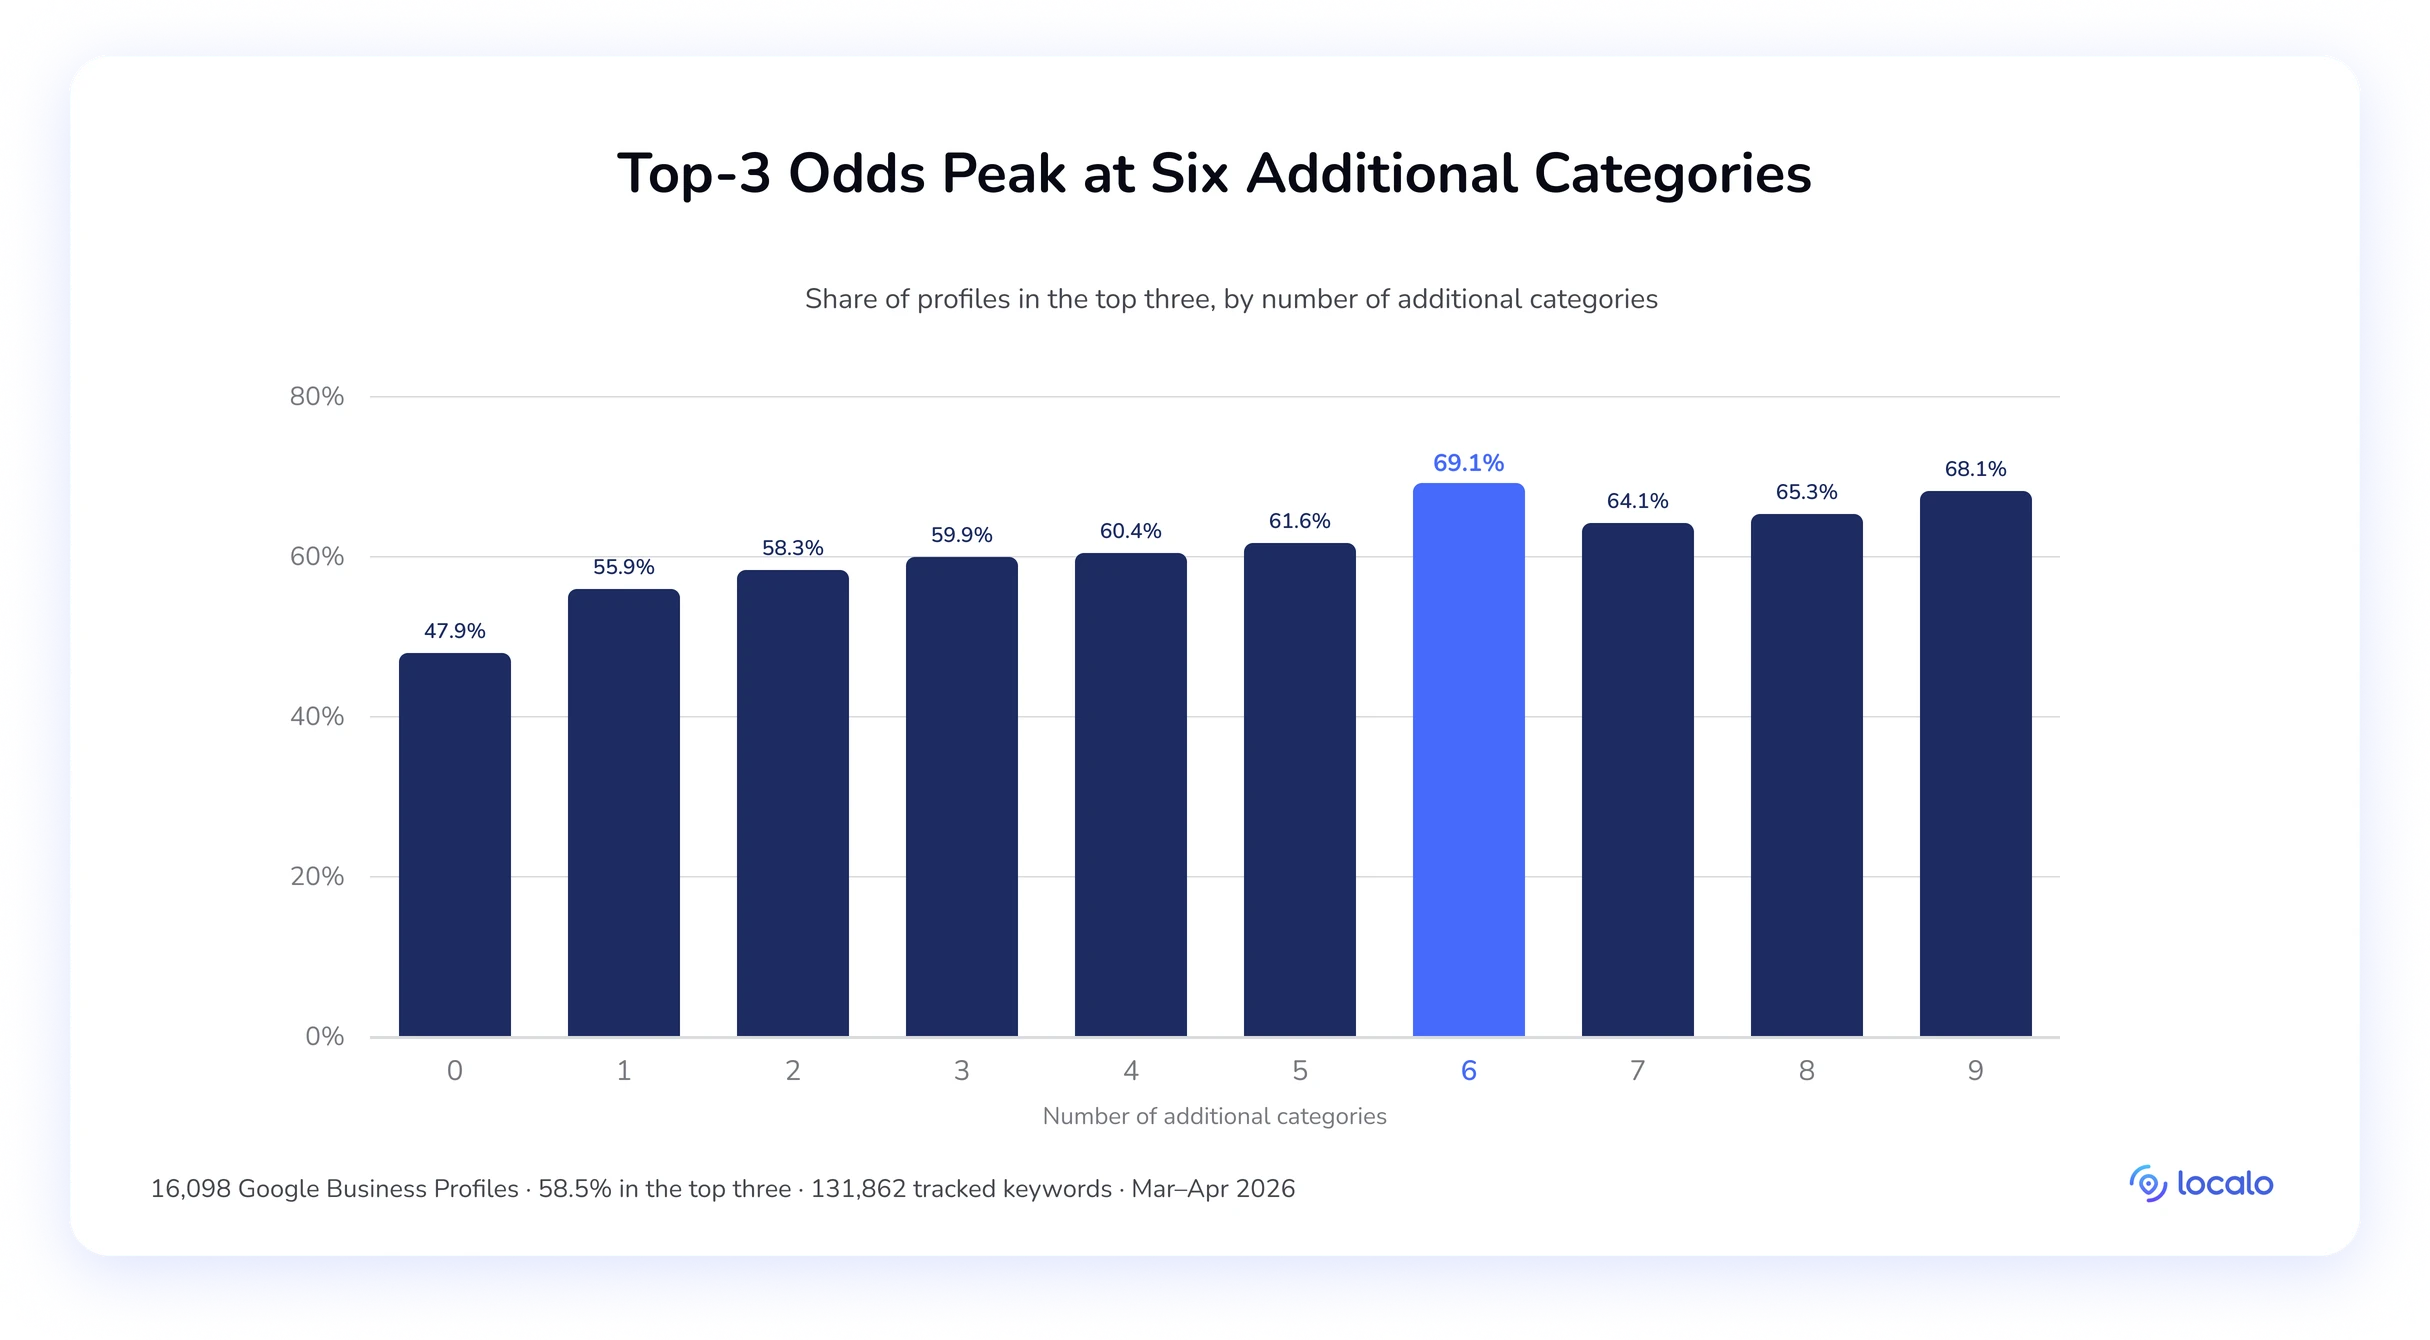
Google allows up to nine additional categories. How many should you actually use? The top-three rate climbs with each one: 47.9% at zero, 55.9% at one, 59.9% at three, 61.6% at five, then jumps to 69.1% at six, the peak. After that, it slips to 64.1% at seven before recovering to 68.1% at nine.
Six is the number to aim for, and the spread from zero to six is 21.2 points: one of the largest gains available from a change you can finish in a single sitting.
🔎 Key takeaway:
Six additional categories is the target: a 69.1% top-three rate against 47.9% for profiles with none, a 21.2-point spread. Profiles at #1 carry 37.0% more categories than #11+. This is a one-sitting fix on most profiles, and the one place where a competitor audit pays off directly. Category lists are public.
6. Citations
NAP management can be a pain for local SEOs, so here’s good news: you don’t need to build citations indefinitely. Citations still carry a real signal in our data, but it has a ceiling, and it arrives earlier than most citation-building packages assume.
| Position groups | 1–3 | 4–10 | 11–20 |
|---|---|---|---|
| Average citations | 60 | 48.3 | 45.8 |
| Median citations | 26 | 17 | 15 |
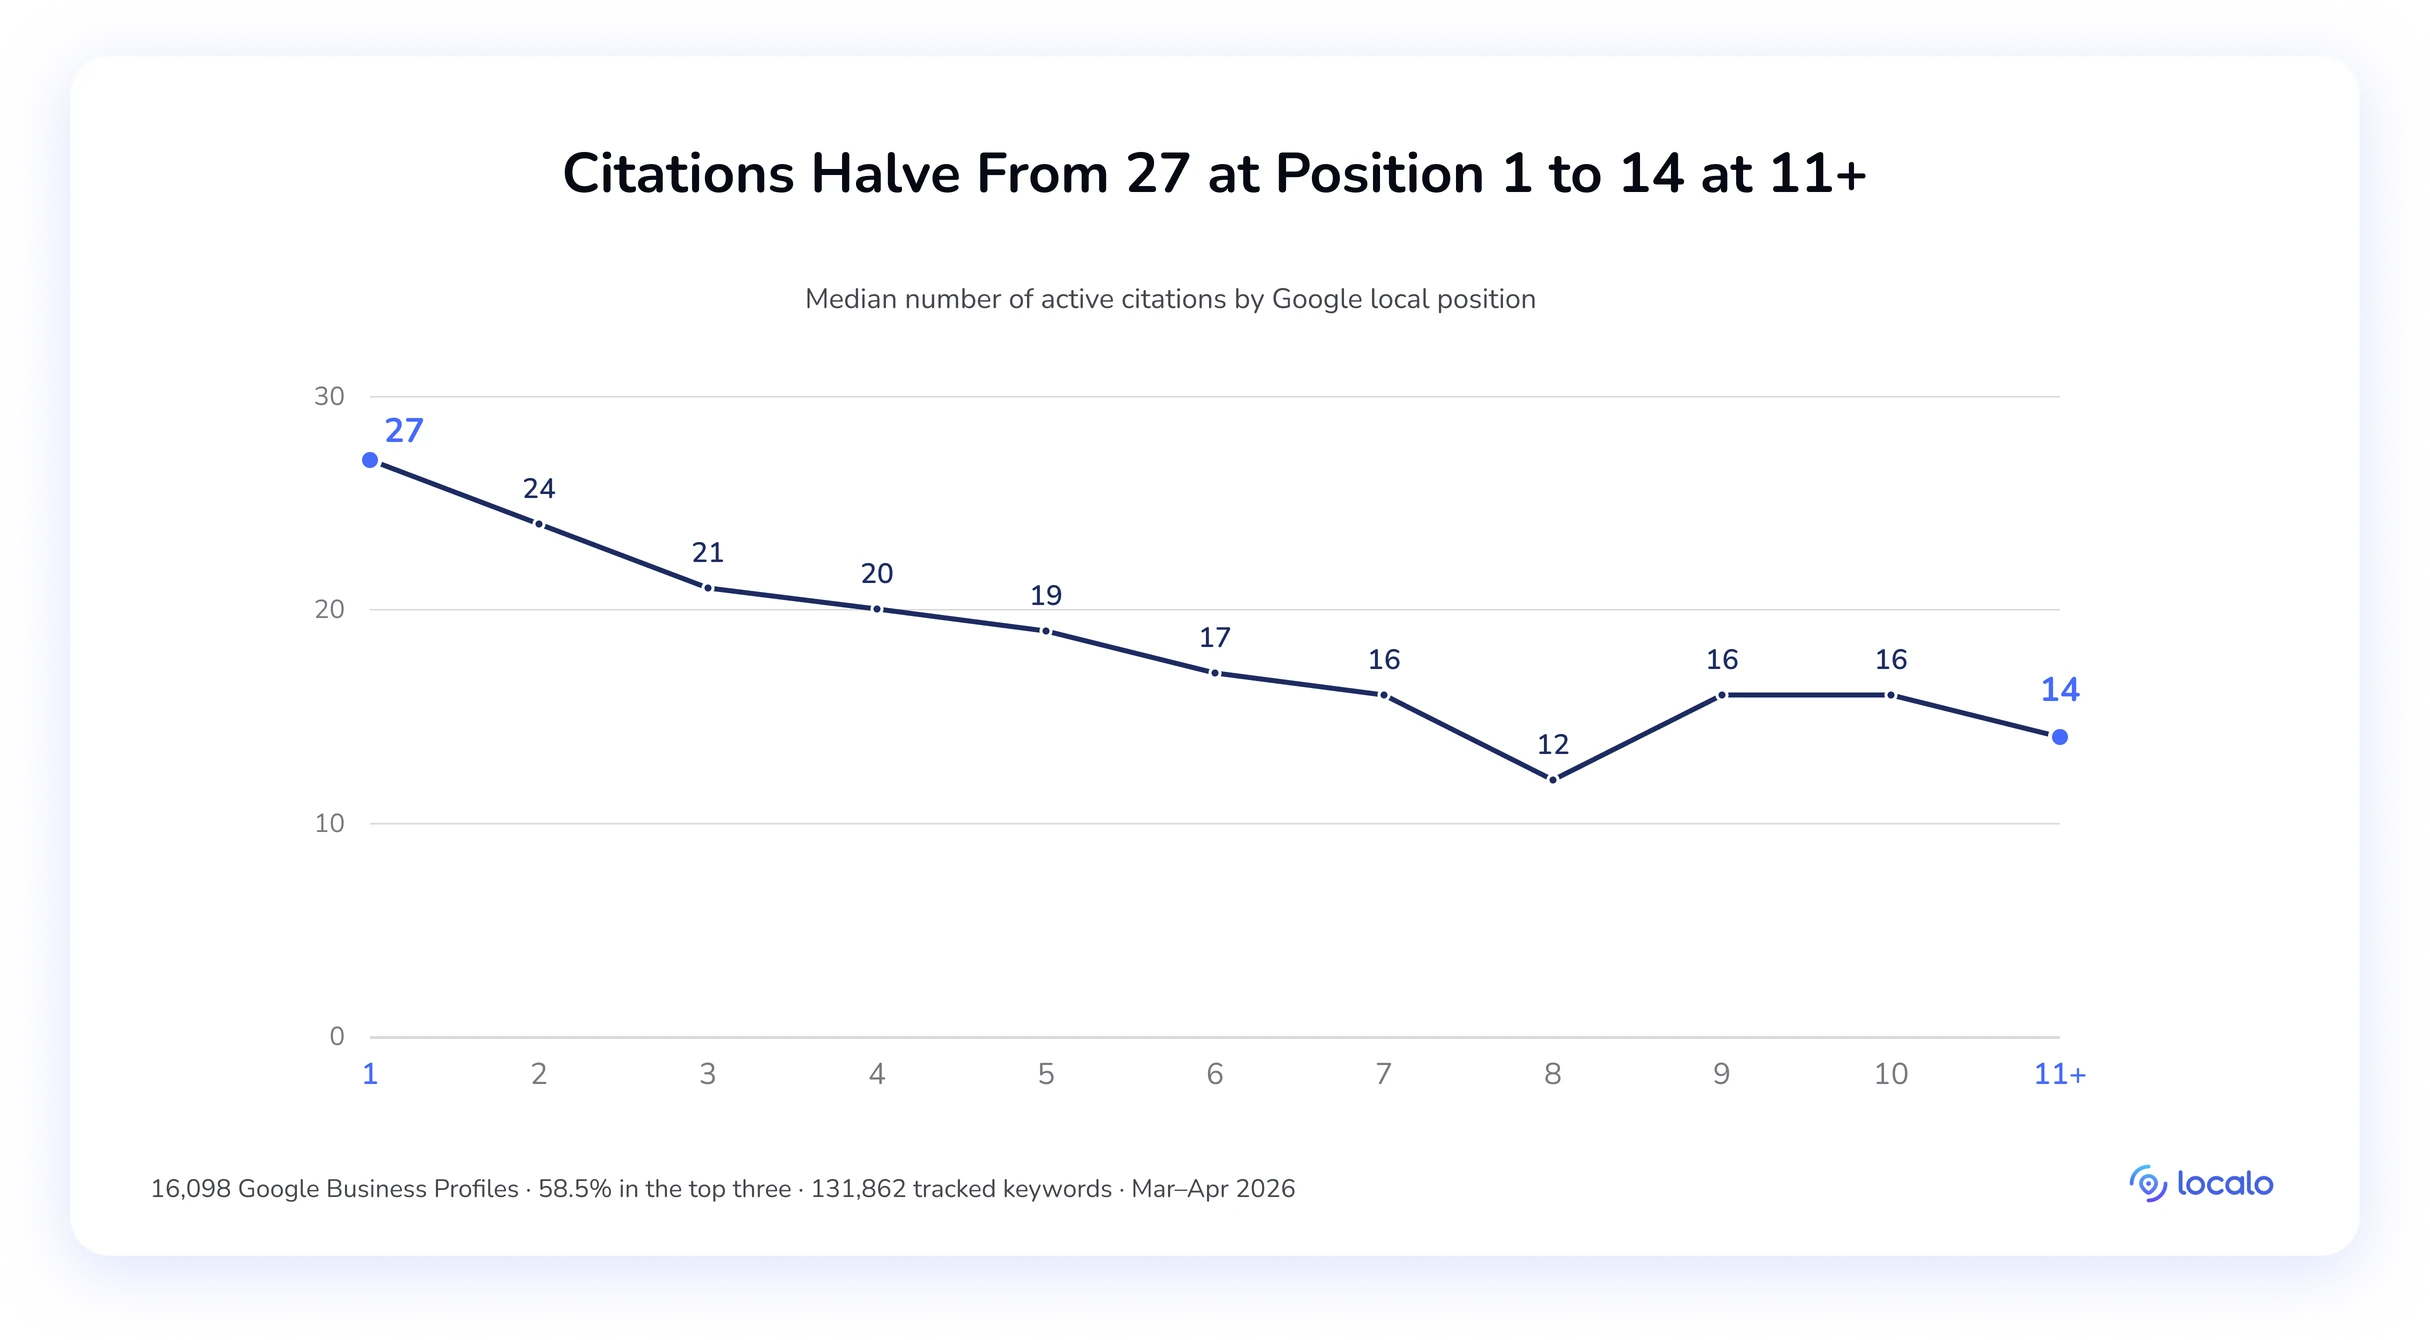
Position by position, the median runs 27 at #1, 24 at #2, 21 at #3, then drifts down to 20 at #4 and 16 at #10, with 14 at #11+. One oddity: #8 sits at 12, below the #11+ median, a reminder that citations aren’t what separates profiles inside page one. The useful reading is the range: 21–27 citations puts a profile in top-three territory, while under 14 puts it in #11+ territory.
By citation count, the payoff front-loads hard. Profiles with 1–5 citations rank top-three 45.0% of the time; 6–10 reach 53.2%, and 11–20 reach 60.0%, a 15-point gain across the first twenty. Then it stalls: 64.9% at 21–50, 65.7% at 51–100, and a dip to 63.0% at 101–200. Even the 200+ bracket only gets to 69.1%, roughly four points above where you already were at fifty.
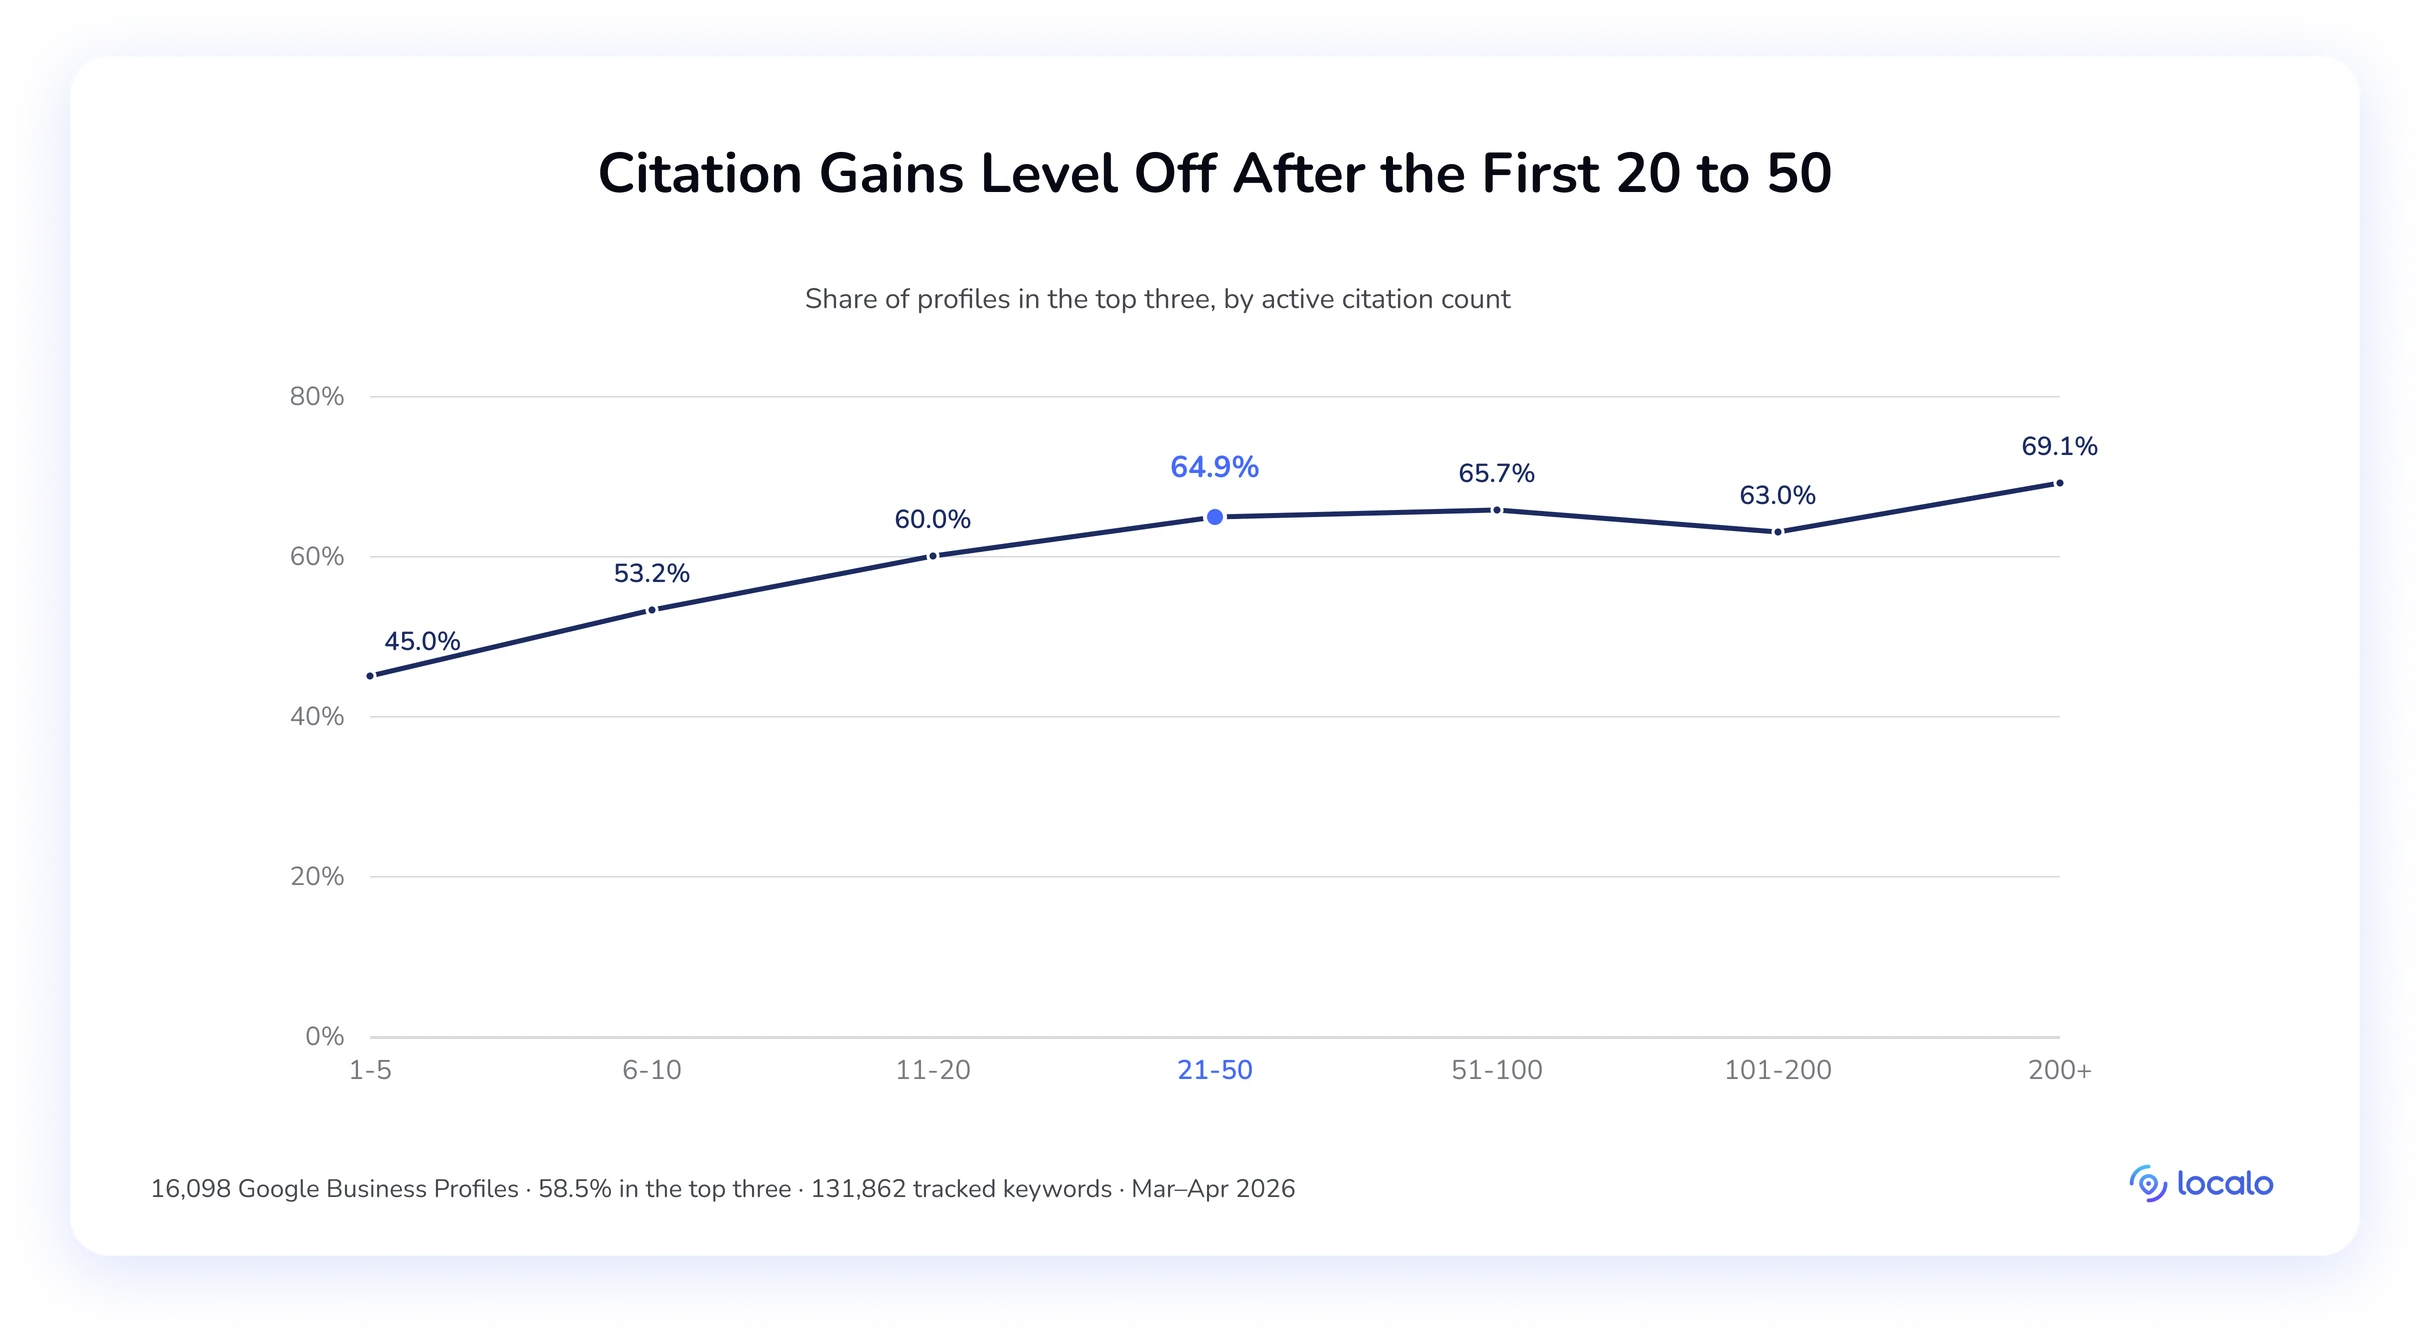
One likely reading: Google needs to confirm a profile’s validity against external sources, and once roughly 20–30 listings have done that, additional ones add little.
🔎 Key takeaway:
Build to 21–27 citations and stop to observe. That’s where top-three profiles sit: median 26 in the grouped view, 27 at position #1, while below 14 is #11+ territory. Everything past thirty is citation building for its own sake. Audit what’s already there for NAP accuracy instead. We didn’t measure consistency, but a listing pointing at the wrong address isn’t doing the profile any favors.
7. Social media links
Linking social accounts is a newer field on the profile, and one of the stronger correlations in our data, with one clear step partway up the curve.
| Position groups | 1–3 | 4–10 | 11–20 |
|---|---|---|---|
| Average social media links | 2.94 | 2.63 | 2.47 |
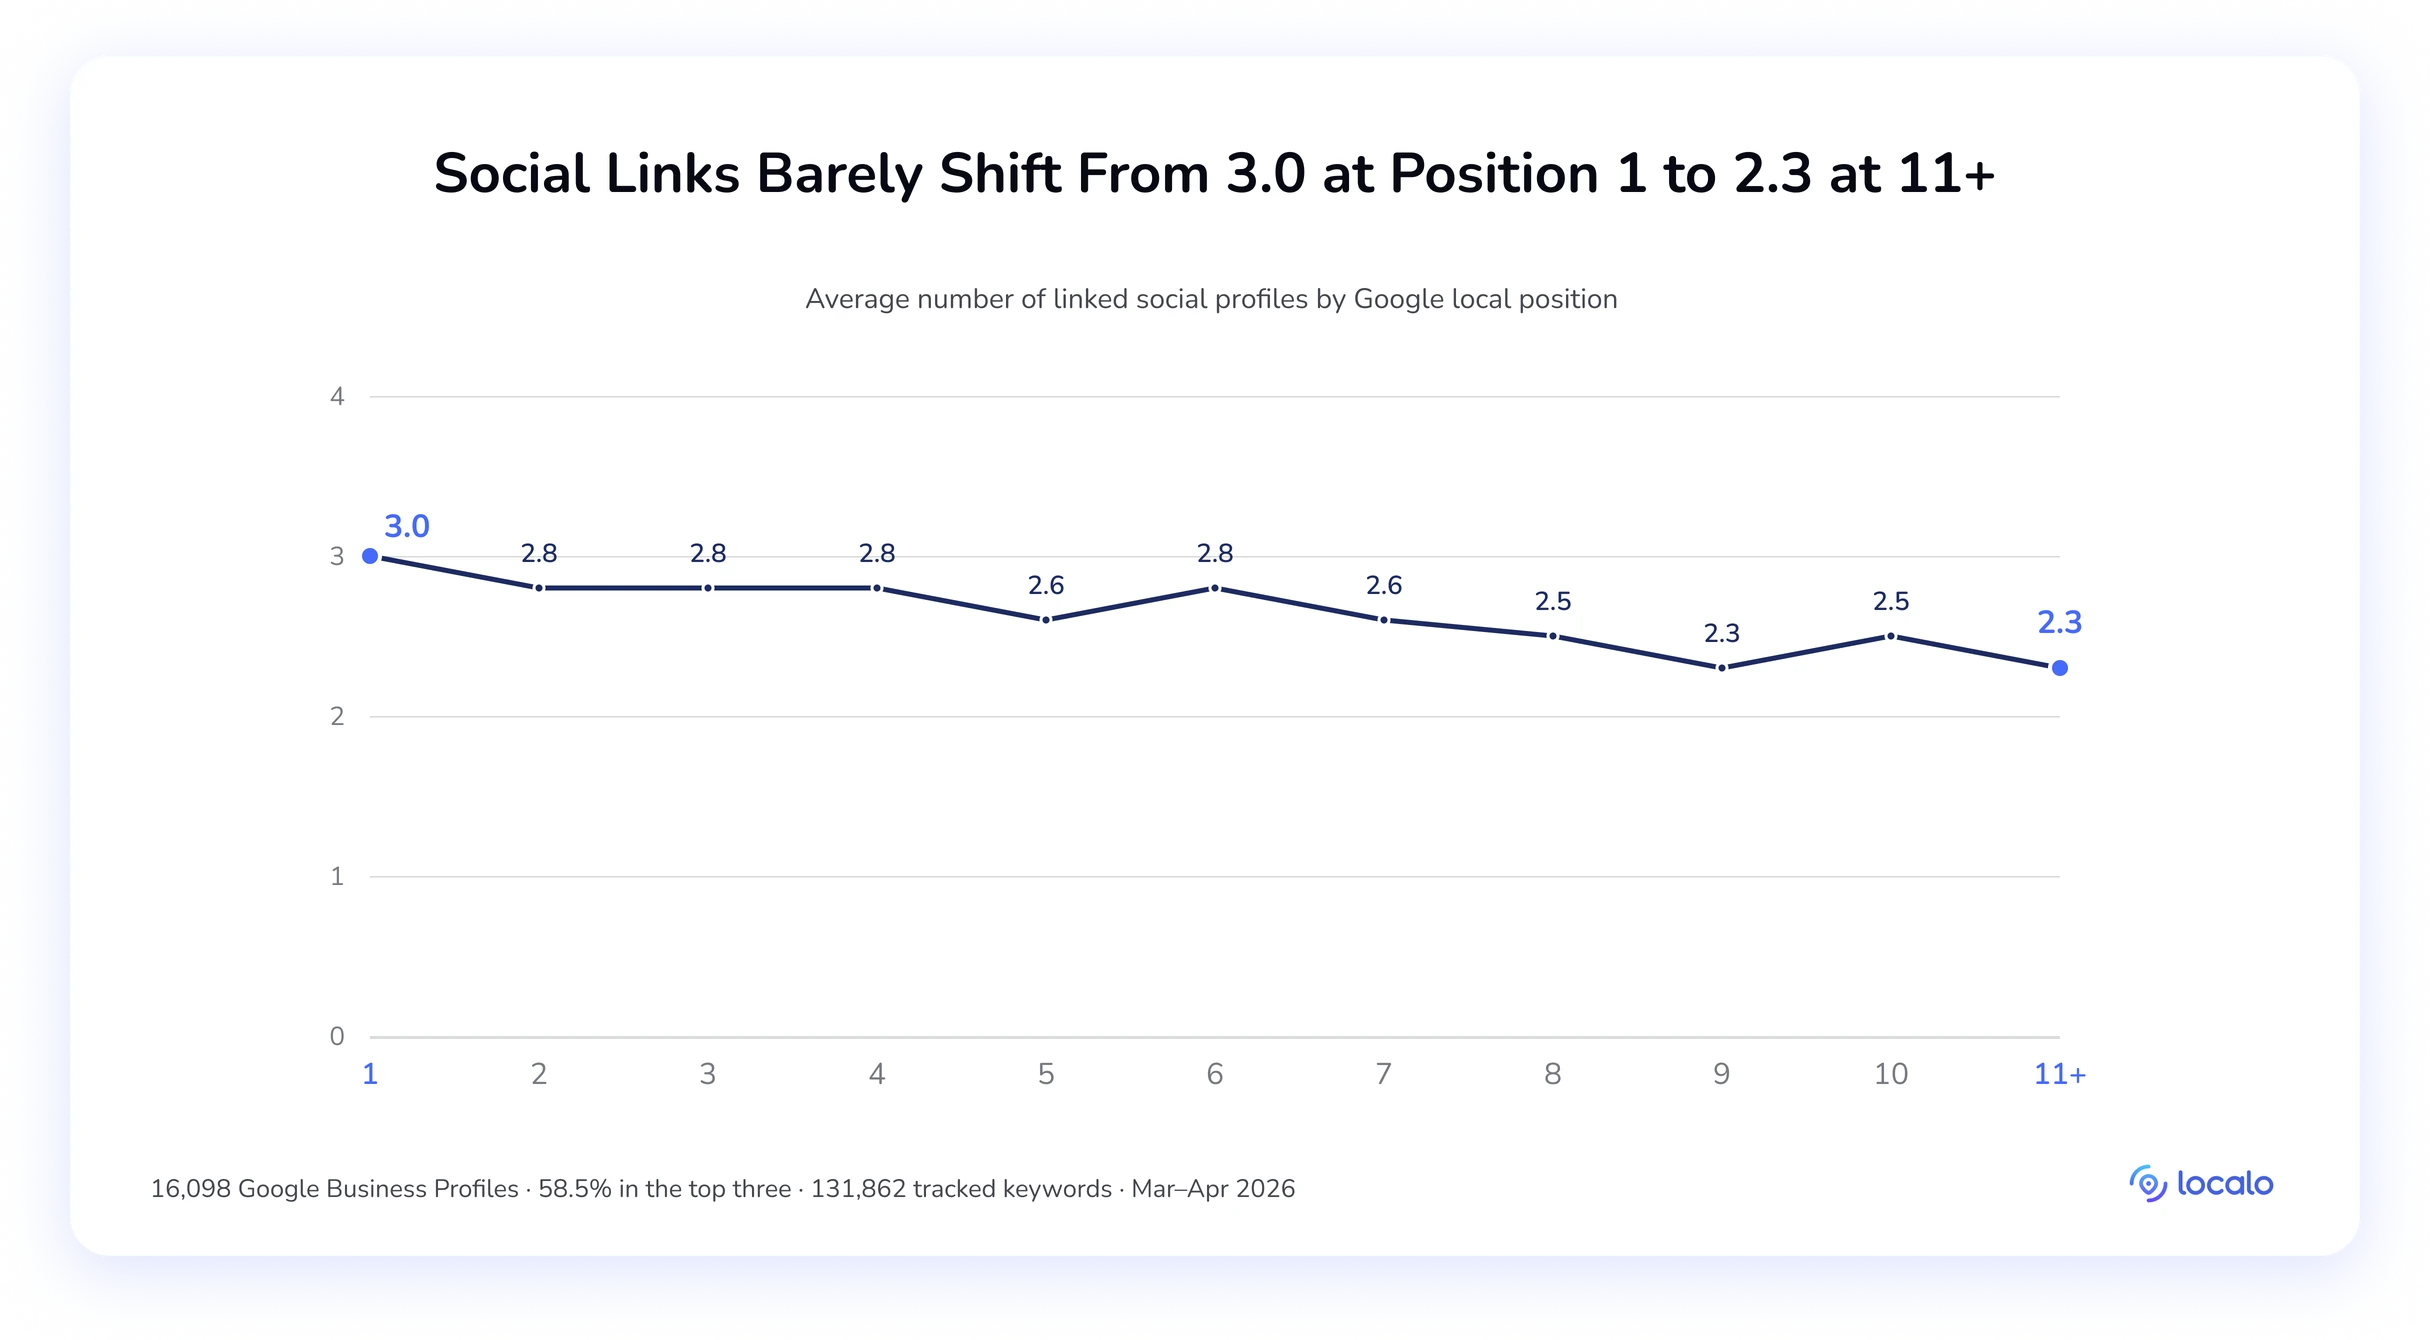
Position by position, the shape matters more than the endpoints. Profiles at #1 average 3 links, the top of the range. Below it, the values arrive in no clean order: 2.8 at #2 through #4 and again at #6, 2.6 at #5 and #7, 2.5 at #8 and #10, 2.3 at #9 and #11+.
The endpoints are 0.7 links apart, so treat this as a weak gradient rather than a threshold, useful for confirming that a sixth or seventh link buys nothing, not for diagnosing a position. Across groups, 86.9% of top-three profiles have at least one link, against 83.6% in positions #4–10 and 79.8% at positions #11–20.
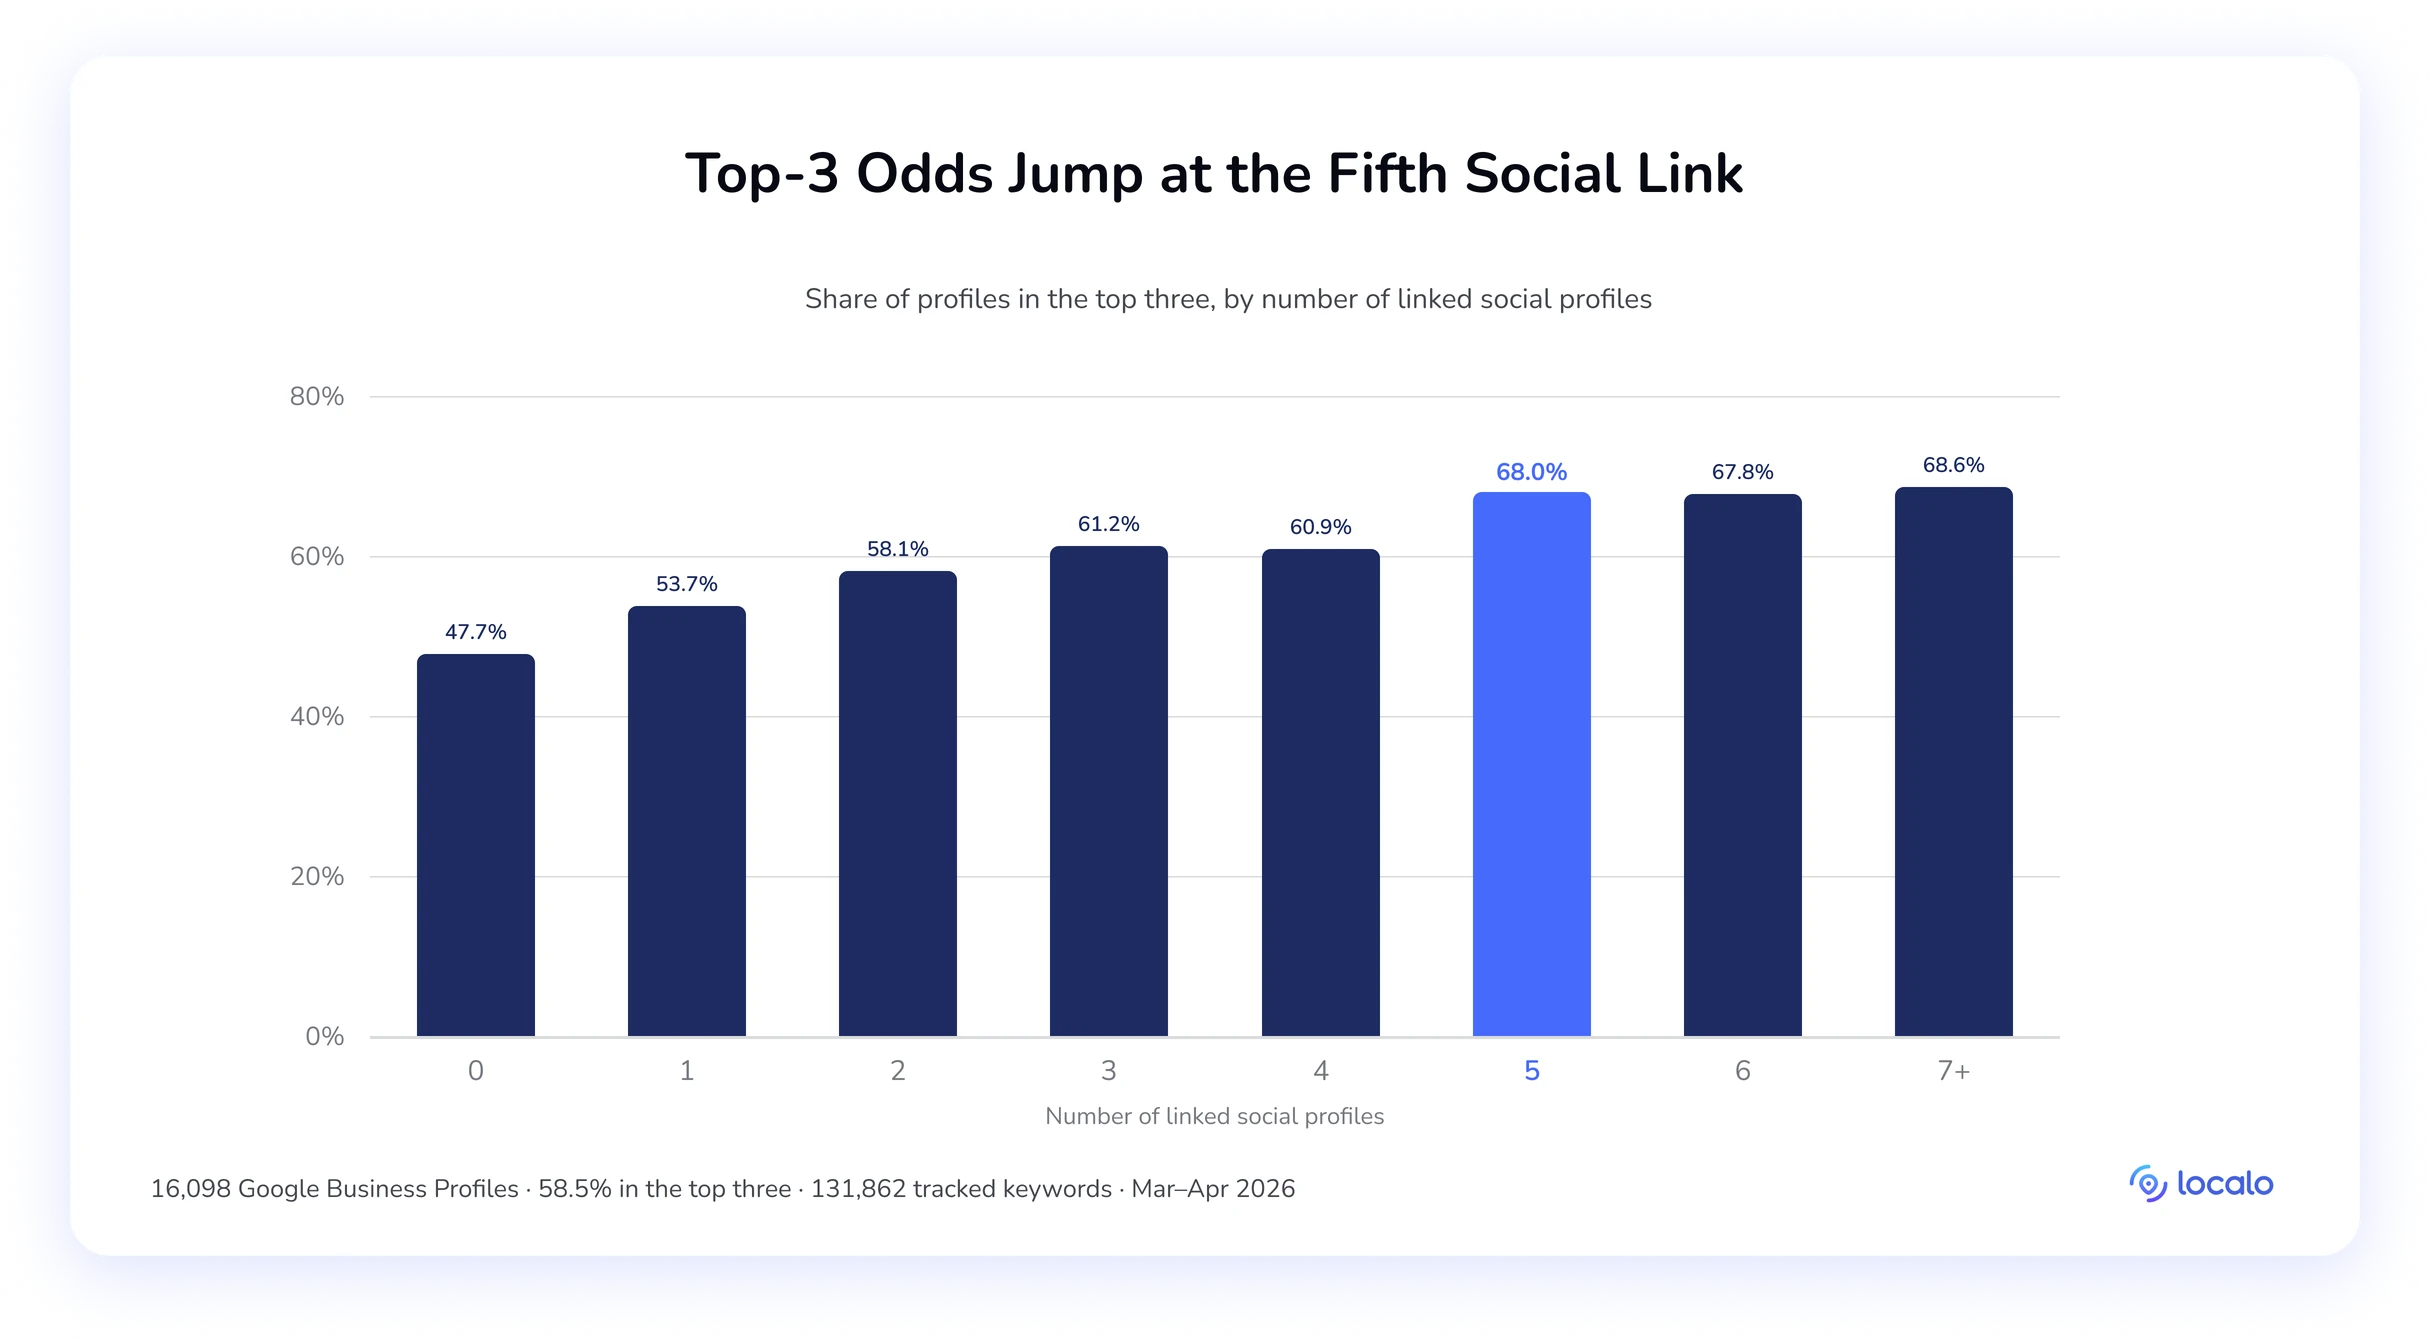
By link count, the curve climbs, stalls, then takes one clear step. Zero links sits at a 47.7% top-three rate, climbing to 53.7% at one link, 58.1% at two, and 61.2% at three.
Then it stalls, with four links actually marginally lower at 60.9%. The second step arrives at five links: 68.0%, holding there through six (67.8%) and seven or more (68.6%).
So three links get a profile into the competitive band, and five is where the rate steps up again. Beyond five, adding links buys nothing.
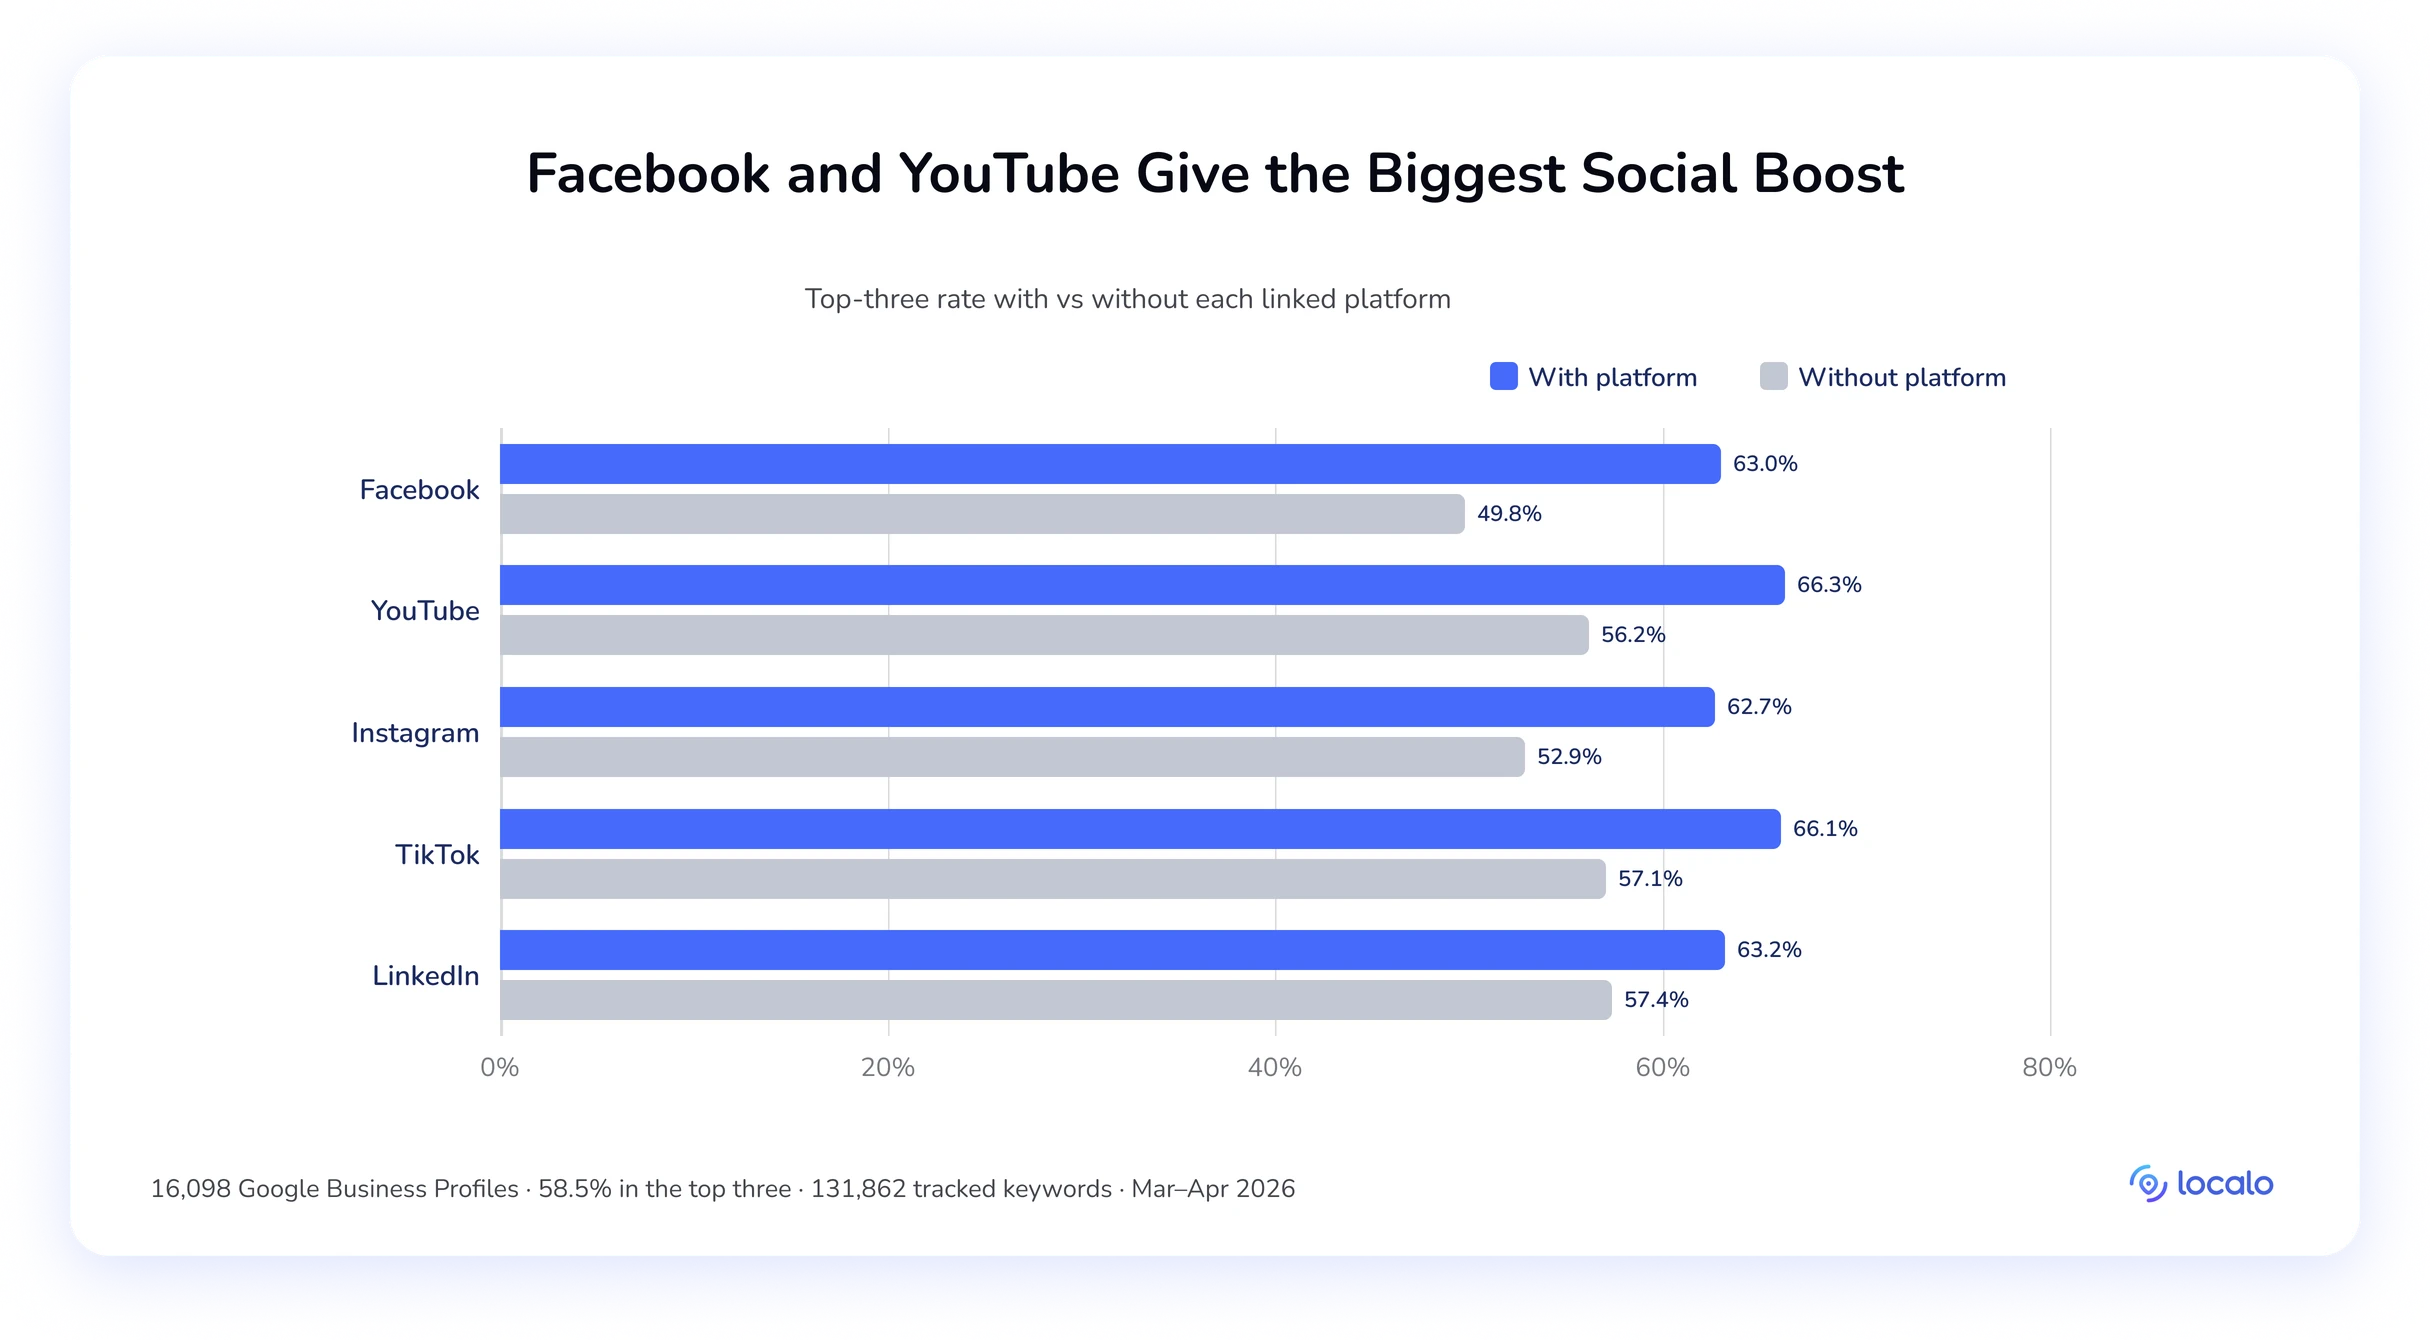
Localo also checked which platforms show the most extensive ranking-impact gap (top-3 rate with vs without). Facebook and YouTube lead: +13.2pp and +10.1pp respectively. Instagram and TikTok follow, with LinkedIn last.
🔎 Key takeaway:
Two numbers to hold: three links to reach the competitive band, five to reach the plateau at 68%, which holds flat through seven or more (68.6%). Facebook first (+13.2pp), then YouTube (+10.1pp). Past five links, the curve stops moving, so this is a task with a finish line.
8. Google posts
Publishing Google Business Profile posts tracks with ranking, and we measured it on the 10 most recent posts per business.
| Position groups | 1–3 | 4–10 | 11–20 |
|---|---|---|---|
| % publishing posts | 86.4% | 83.1% | 80.0% |
Profiles that post rank top-three 70.8% of the time, compared with 63.7% for those that don’t. That +7.1pp gap is one of the larger single-factor differences in the study, and the fastest to close.
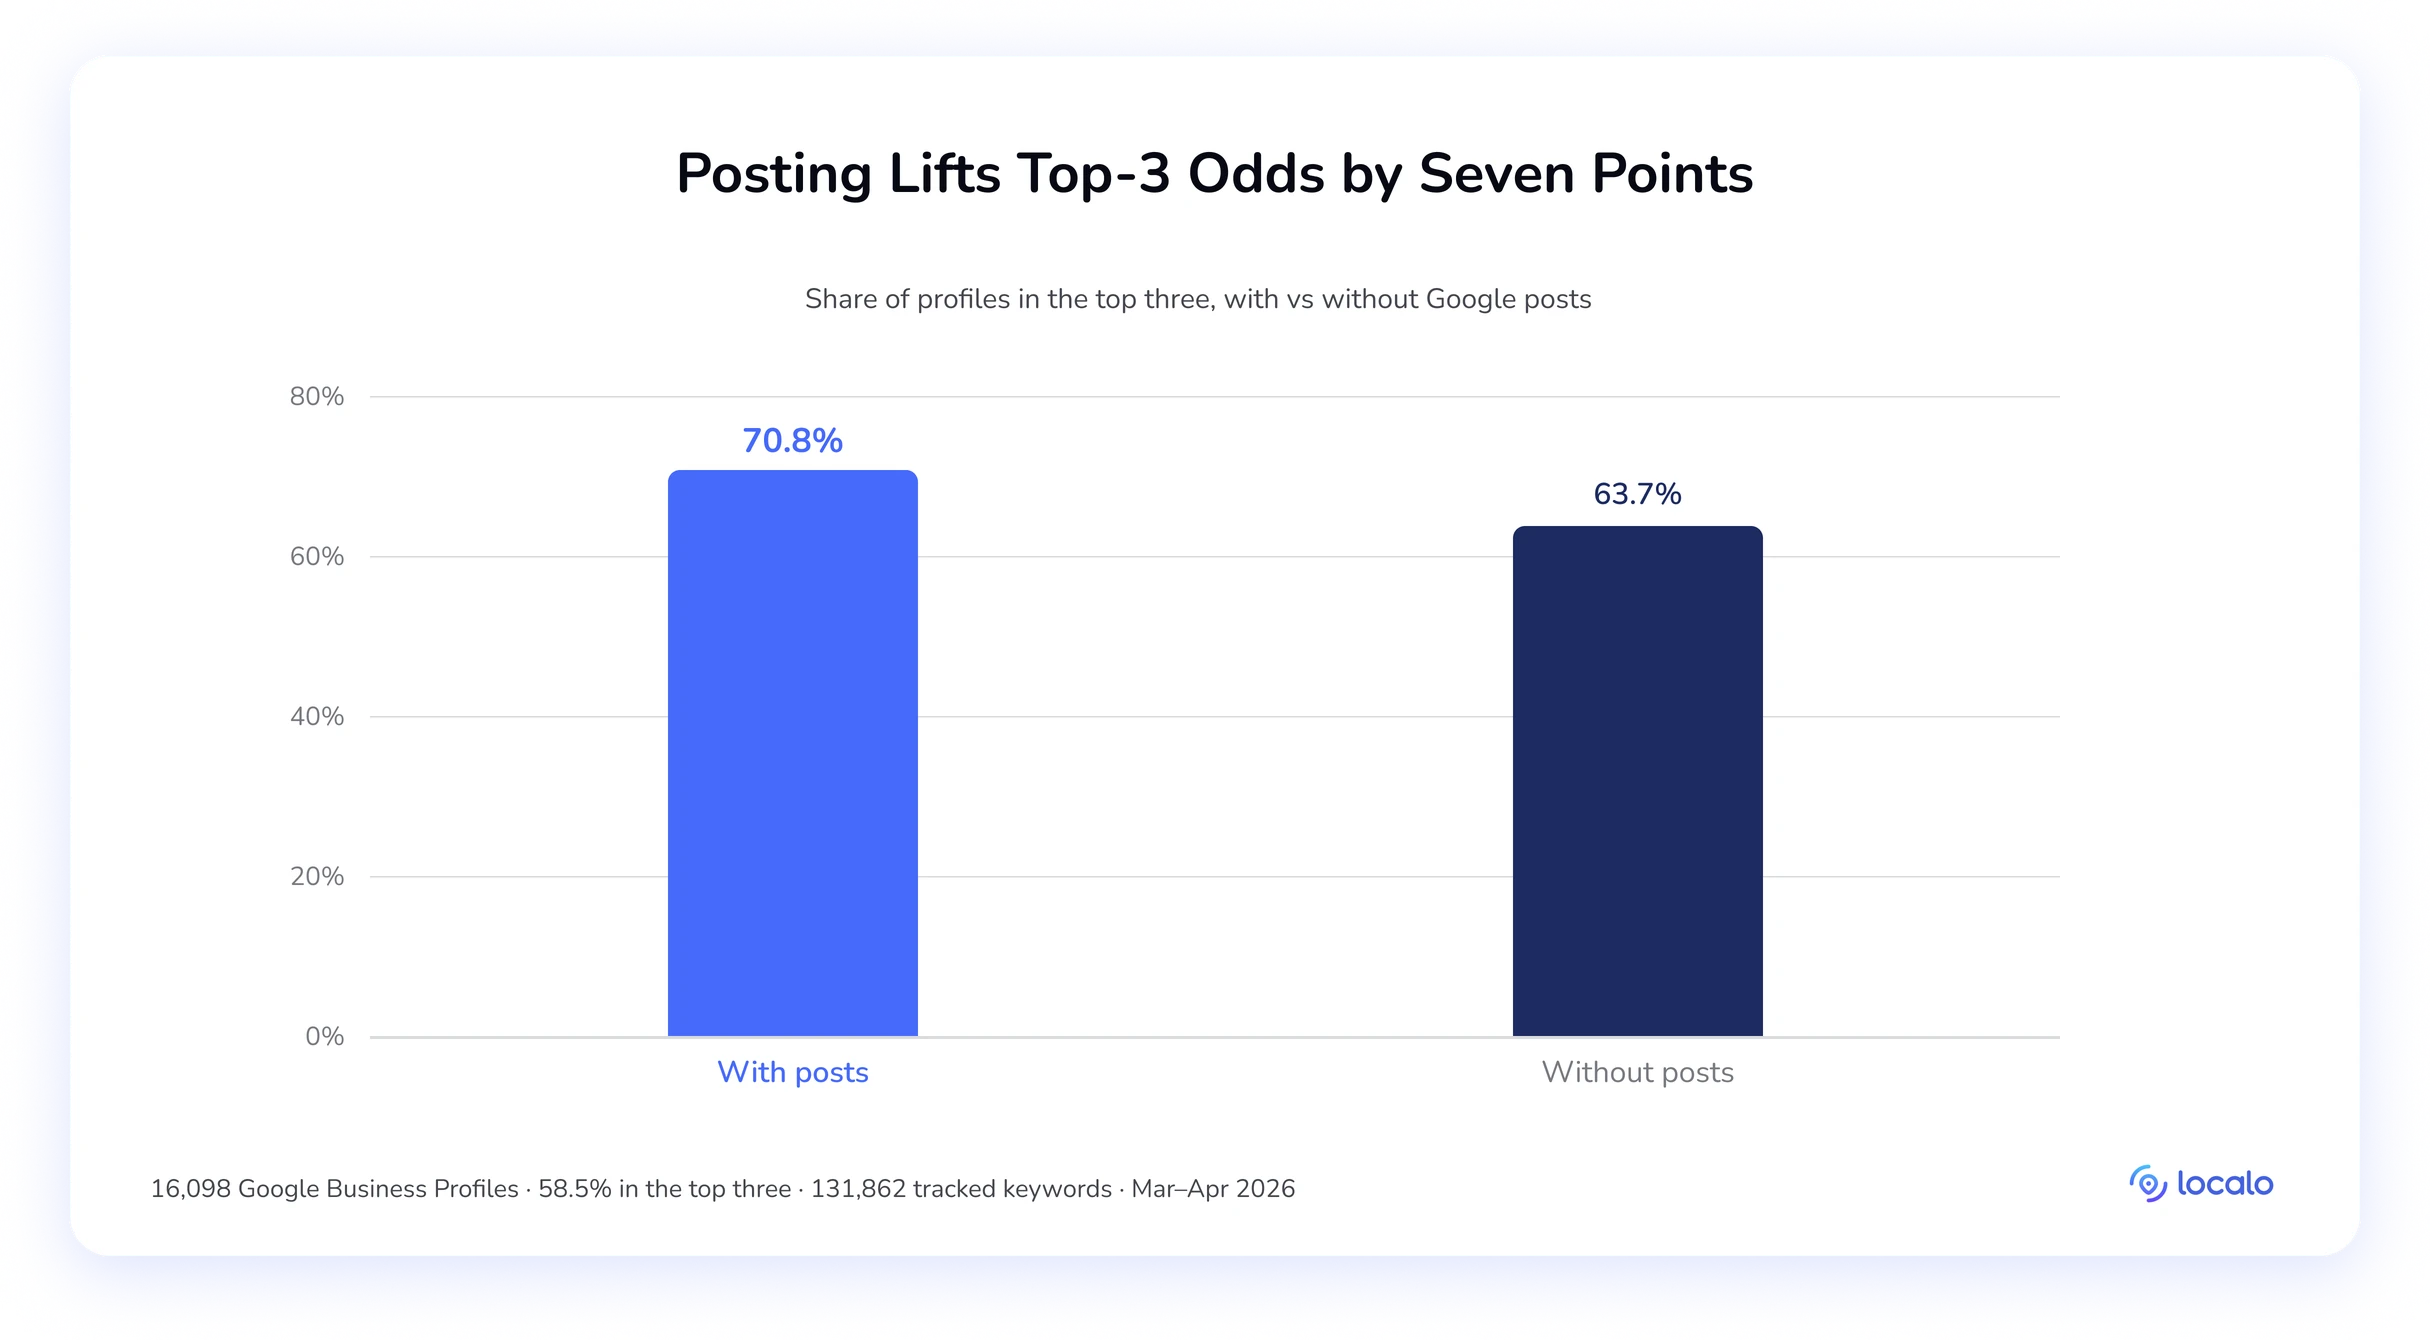
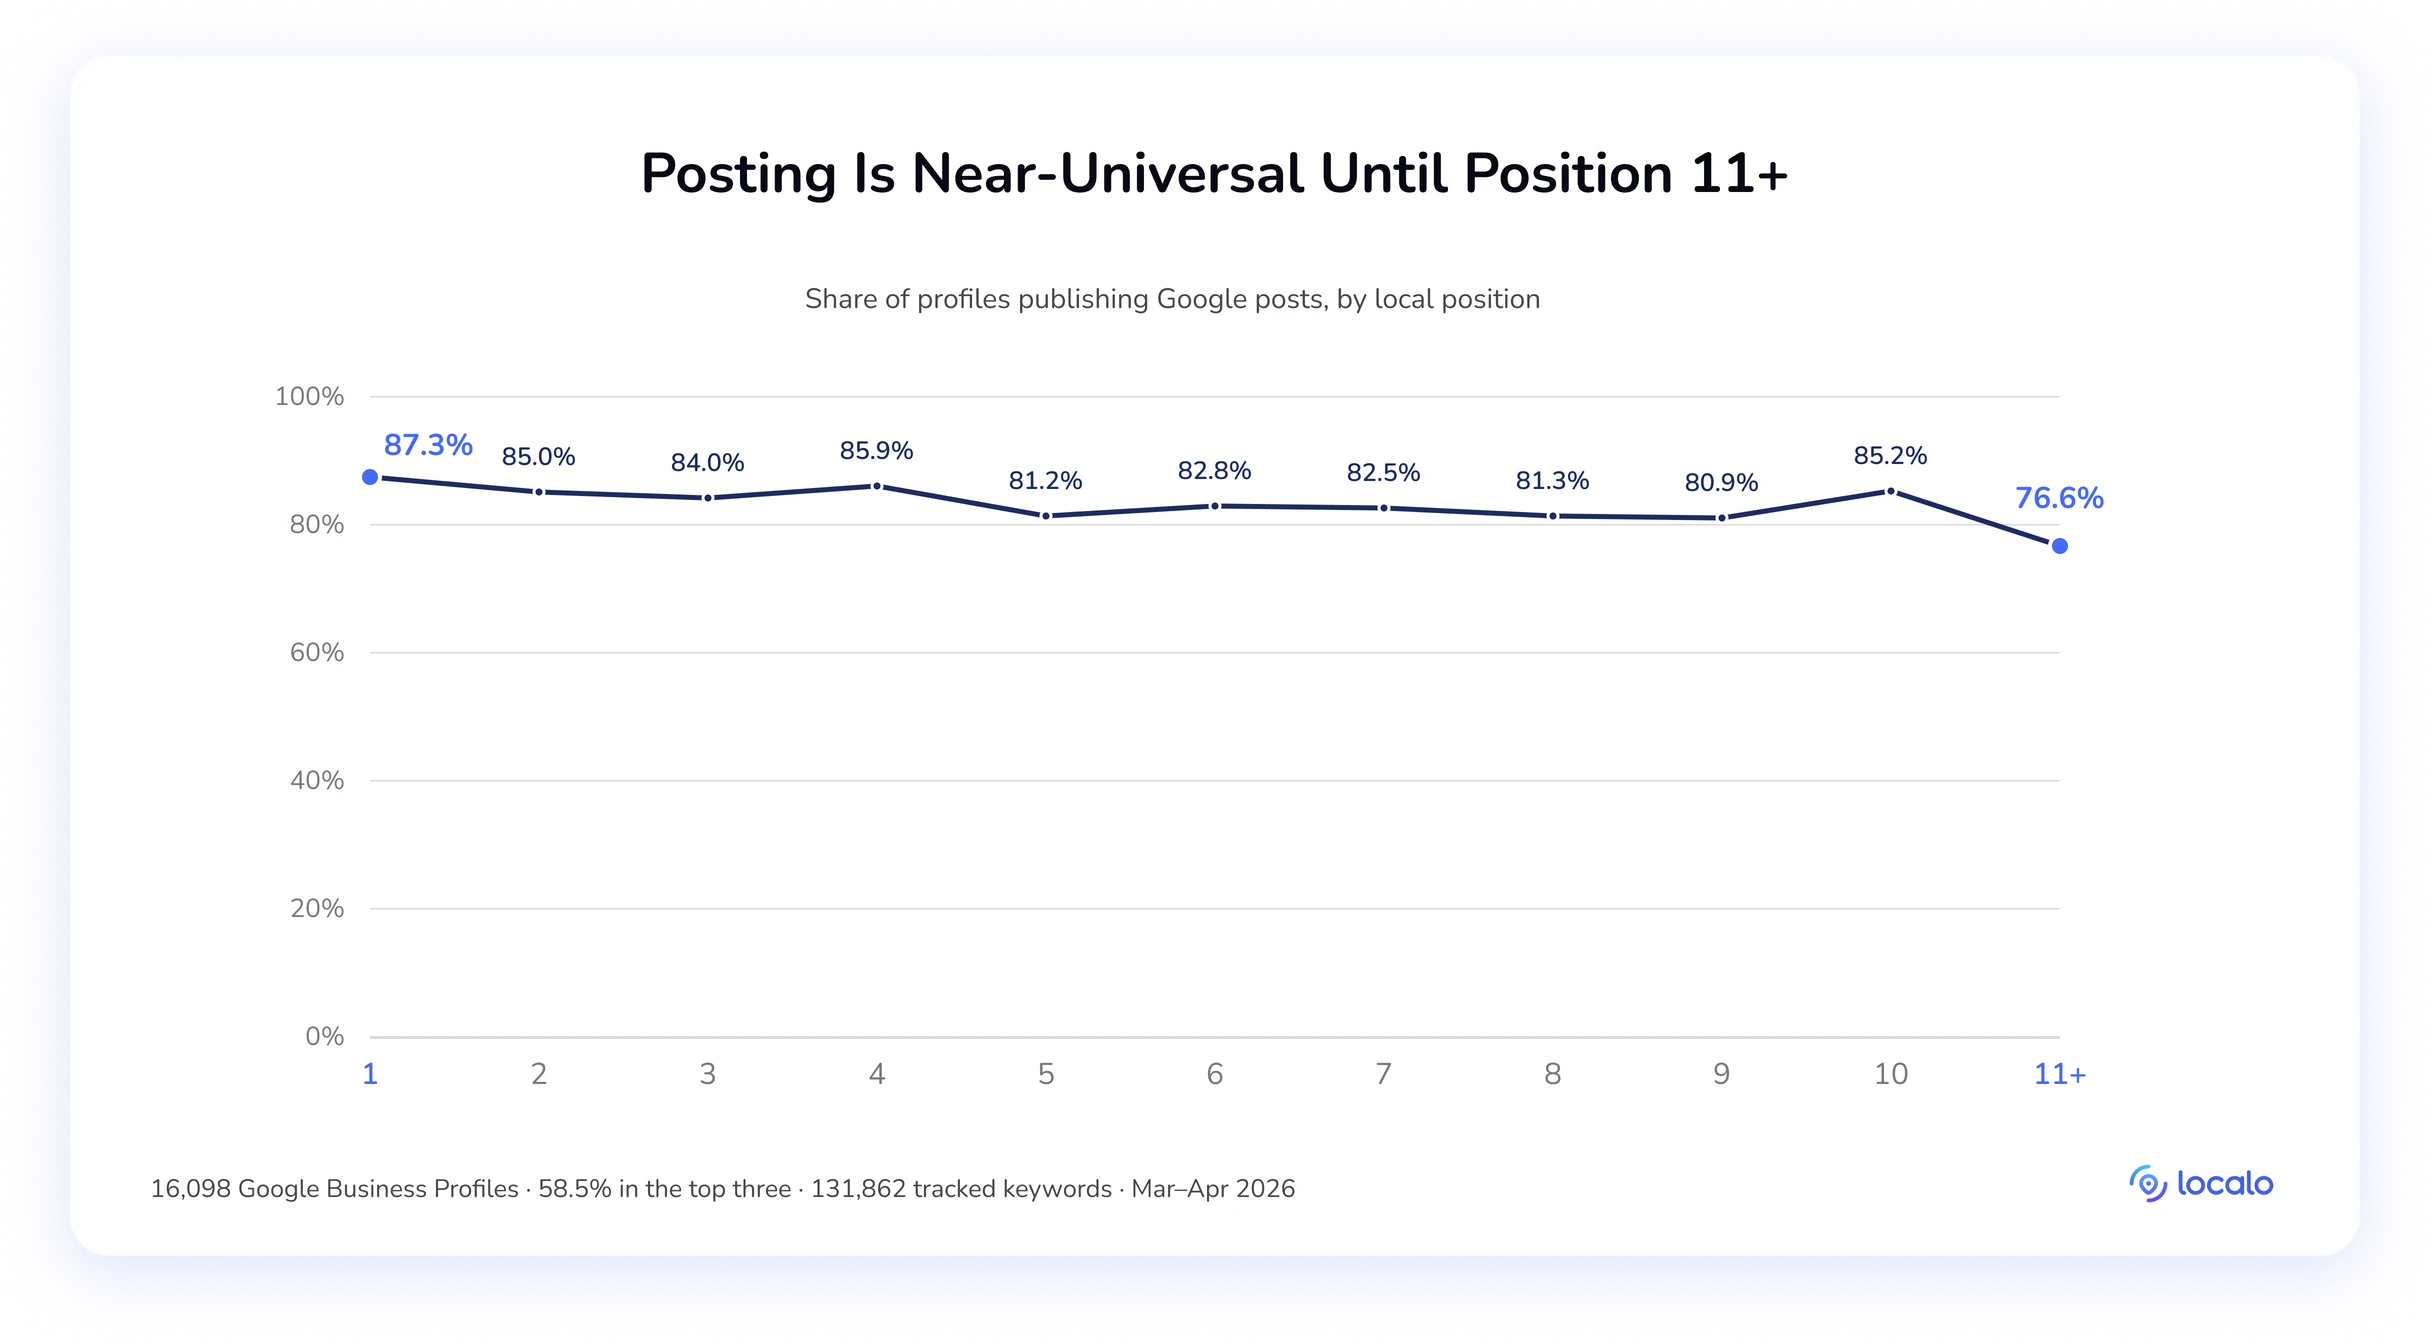
Posts behave like the other hygiene factors: high prevalence everywhere on page one, with the gap opening at the page boundary. Everything from #1 to #10 holds between 80.9% and 87.3%, then it falls to 76.6% at #11+. The grouped table reads 80.0% for positions #11–20.
Now the contents. Localo checked post length, type (post vs offer), frequency, and category keywords in the post text. None of them move rankings. Profiles using category keywords in posts rank top-three 70.8% of the time, identical to those that don’t. Offer posts rank top-three 71.5% of the time against 70.6% for post-only, a gap you could get from rounding. (The separate 131K tracked-keyword analysis further down finds a marginal +1.8pp for word stems in post text; that’s a different test, and posts still come out second-weakest of the four profile areas, ahead only of review text.) Around 90.0% of posts carry a call to action at every position.
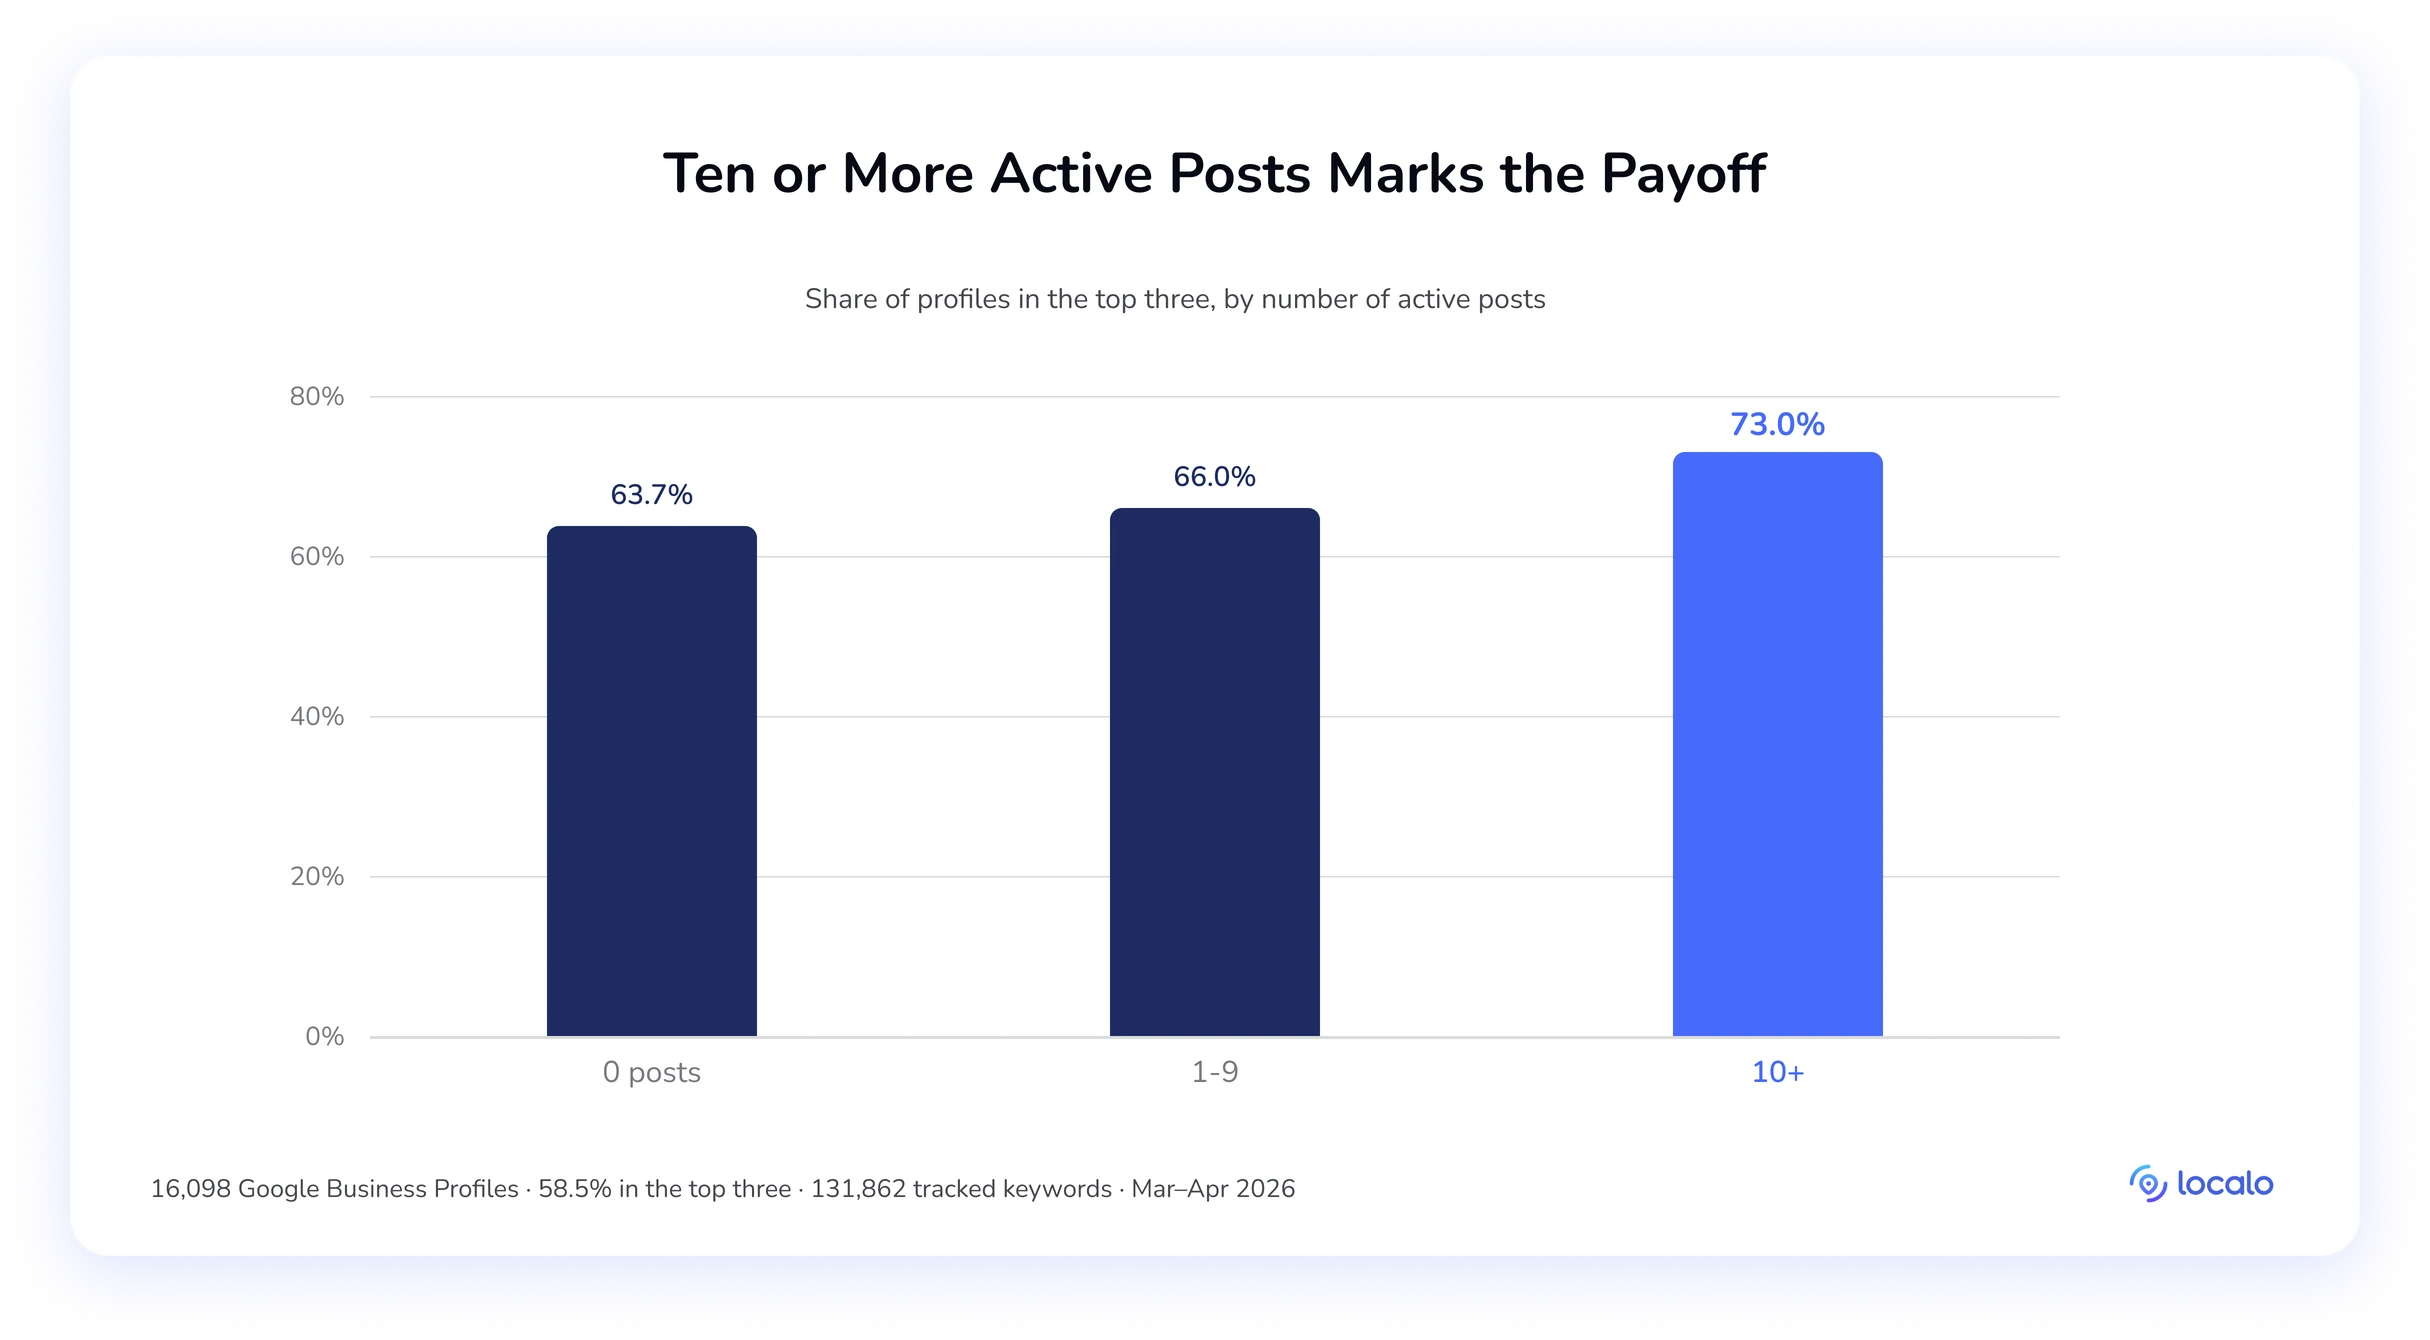
Across the groups we measured, post length holds at about 107 words and pace at about five posts a month, with no variation worth acting on, which is exactly why optimizing them is wasted time. One distinction does hold, though, and it mirrors reviews: total post count correlates, posting pace doesn’t. Profiles with 10+ active posts hit a 73.0% top-3 rate versus 66.0% for 1–9, while monthly posting rate shows nothing (73.0% at under one post a month, 70.5% at eight or more).
🔎 Key takeaway:
Publishing at all is the whole effect. After that, only one number matters: profiles with 10+ active posts hit a 73.0% top-three rate, compared with 66.0% at 1–9. Frequency, length, type, keywords, and CTAs are all flat. Post to communicate with customers rather than to rank.


Local ranking factors you can’t win on
The local search ranking factors described earlier show the widest spreads, and the majority of your effort as a local SEO expert should go there. The three below are different. Two of them nearly every profile already has, so having them buys no edge while missing just one disqualifies you. The third correlates clearly with position, but Google prohibits acting on it.
Website
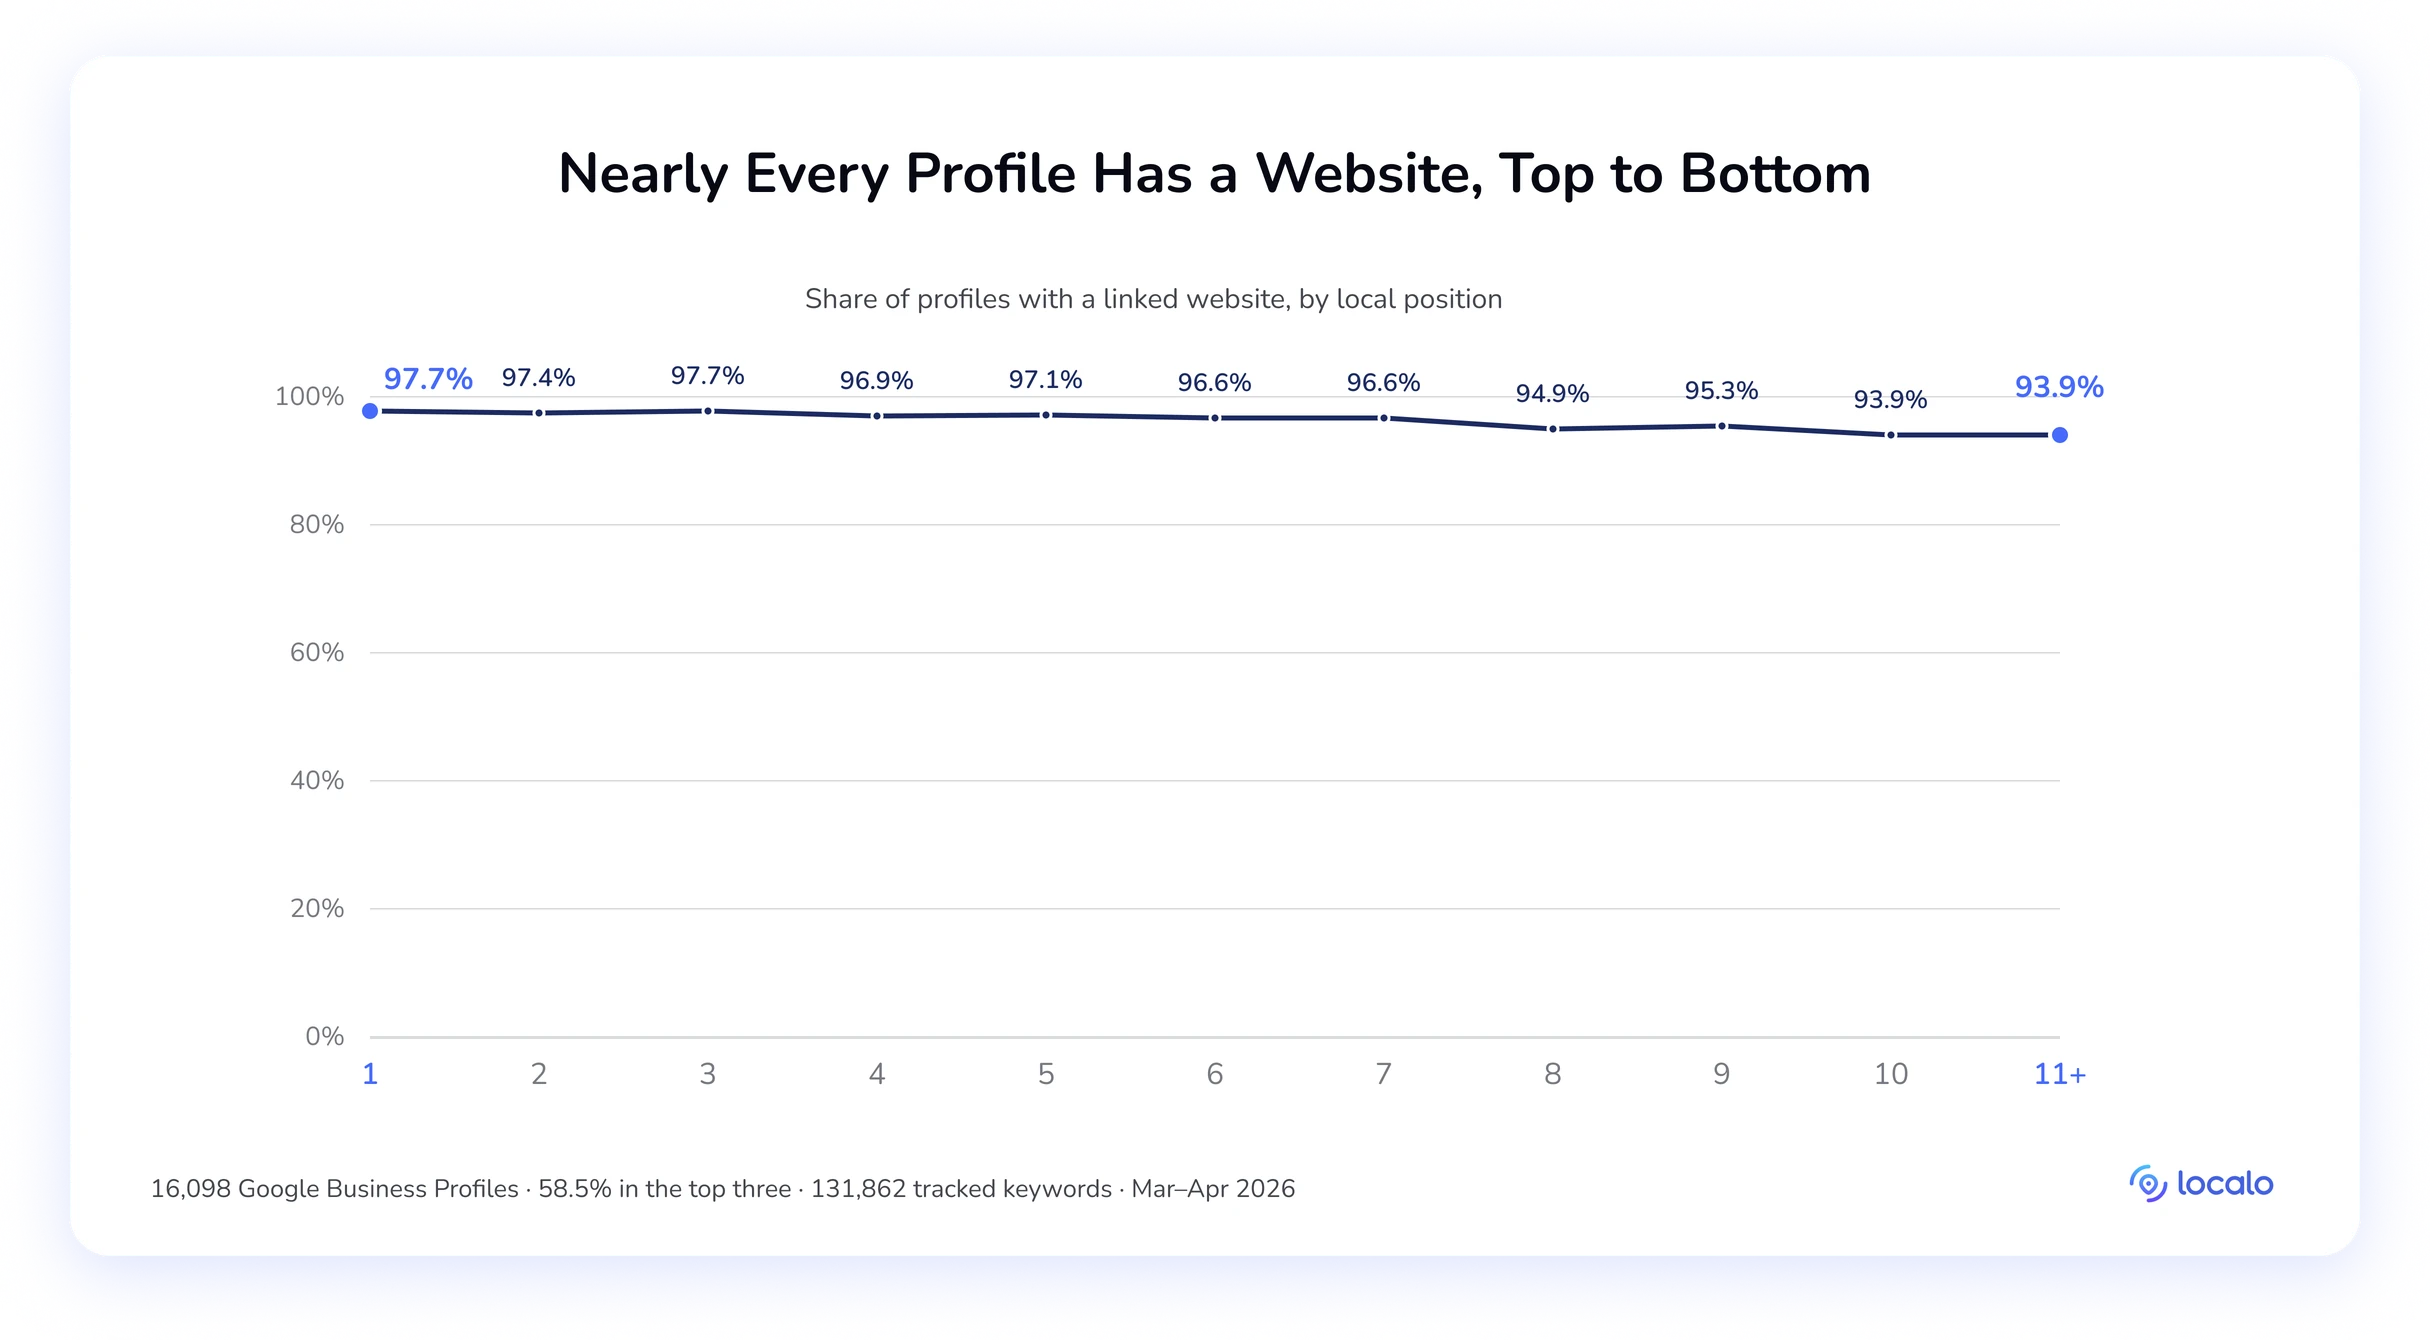
Nearly everyone gets this one right, which is exactly why it won’t differentiate the profiles you manage. The grouped gap between the top three and positions #11–20 is 2.5 points.
| Position groups | 1–3 | 4–10 | 11–20 |
|---|---|---|---|
| % including a website | 97.6% | 96.2% | 95.1% |
Across all positions, the range runs 93.9% to 97.7%, with a slight sag from #8 downward.
🔎 Key takeaway:
If a profile you manage has no website, fix it this week; a one-page site closes the gap. Then check that the NAP on that site matches the profile exactly. We didn’t measure consistency, so treat that as general hygiene rather than a finding from this data.
Business address
Another baseline factor, and the one where the page boundary bites hardest. Verification method is where this usually stalls in practice; if a client is stuck waiting on video verification, that’s a blocker to escalate before you touch anything else.
| Position groups | 1–3 | 4–10 | 11–20 |
|---|---|---|---|
| % with verified address | 95.1% | 90.9% | 87.4% |
Verified addresses hold between 89.1% and 95.4% across the top 10, then fall to 83.4% at #11+, a 7pp cliff in a single step down from #10’s 90.4%.
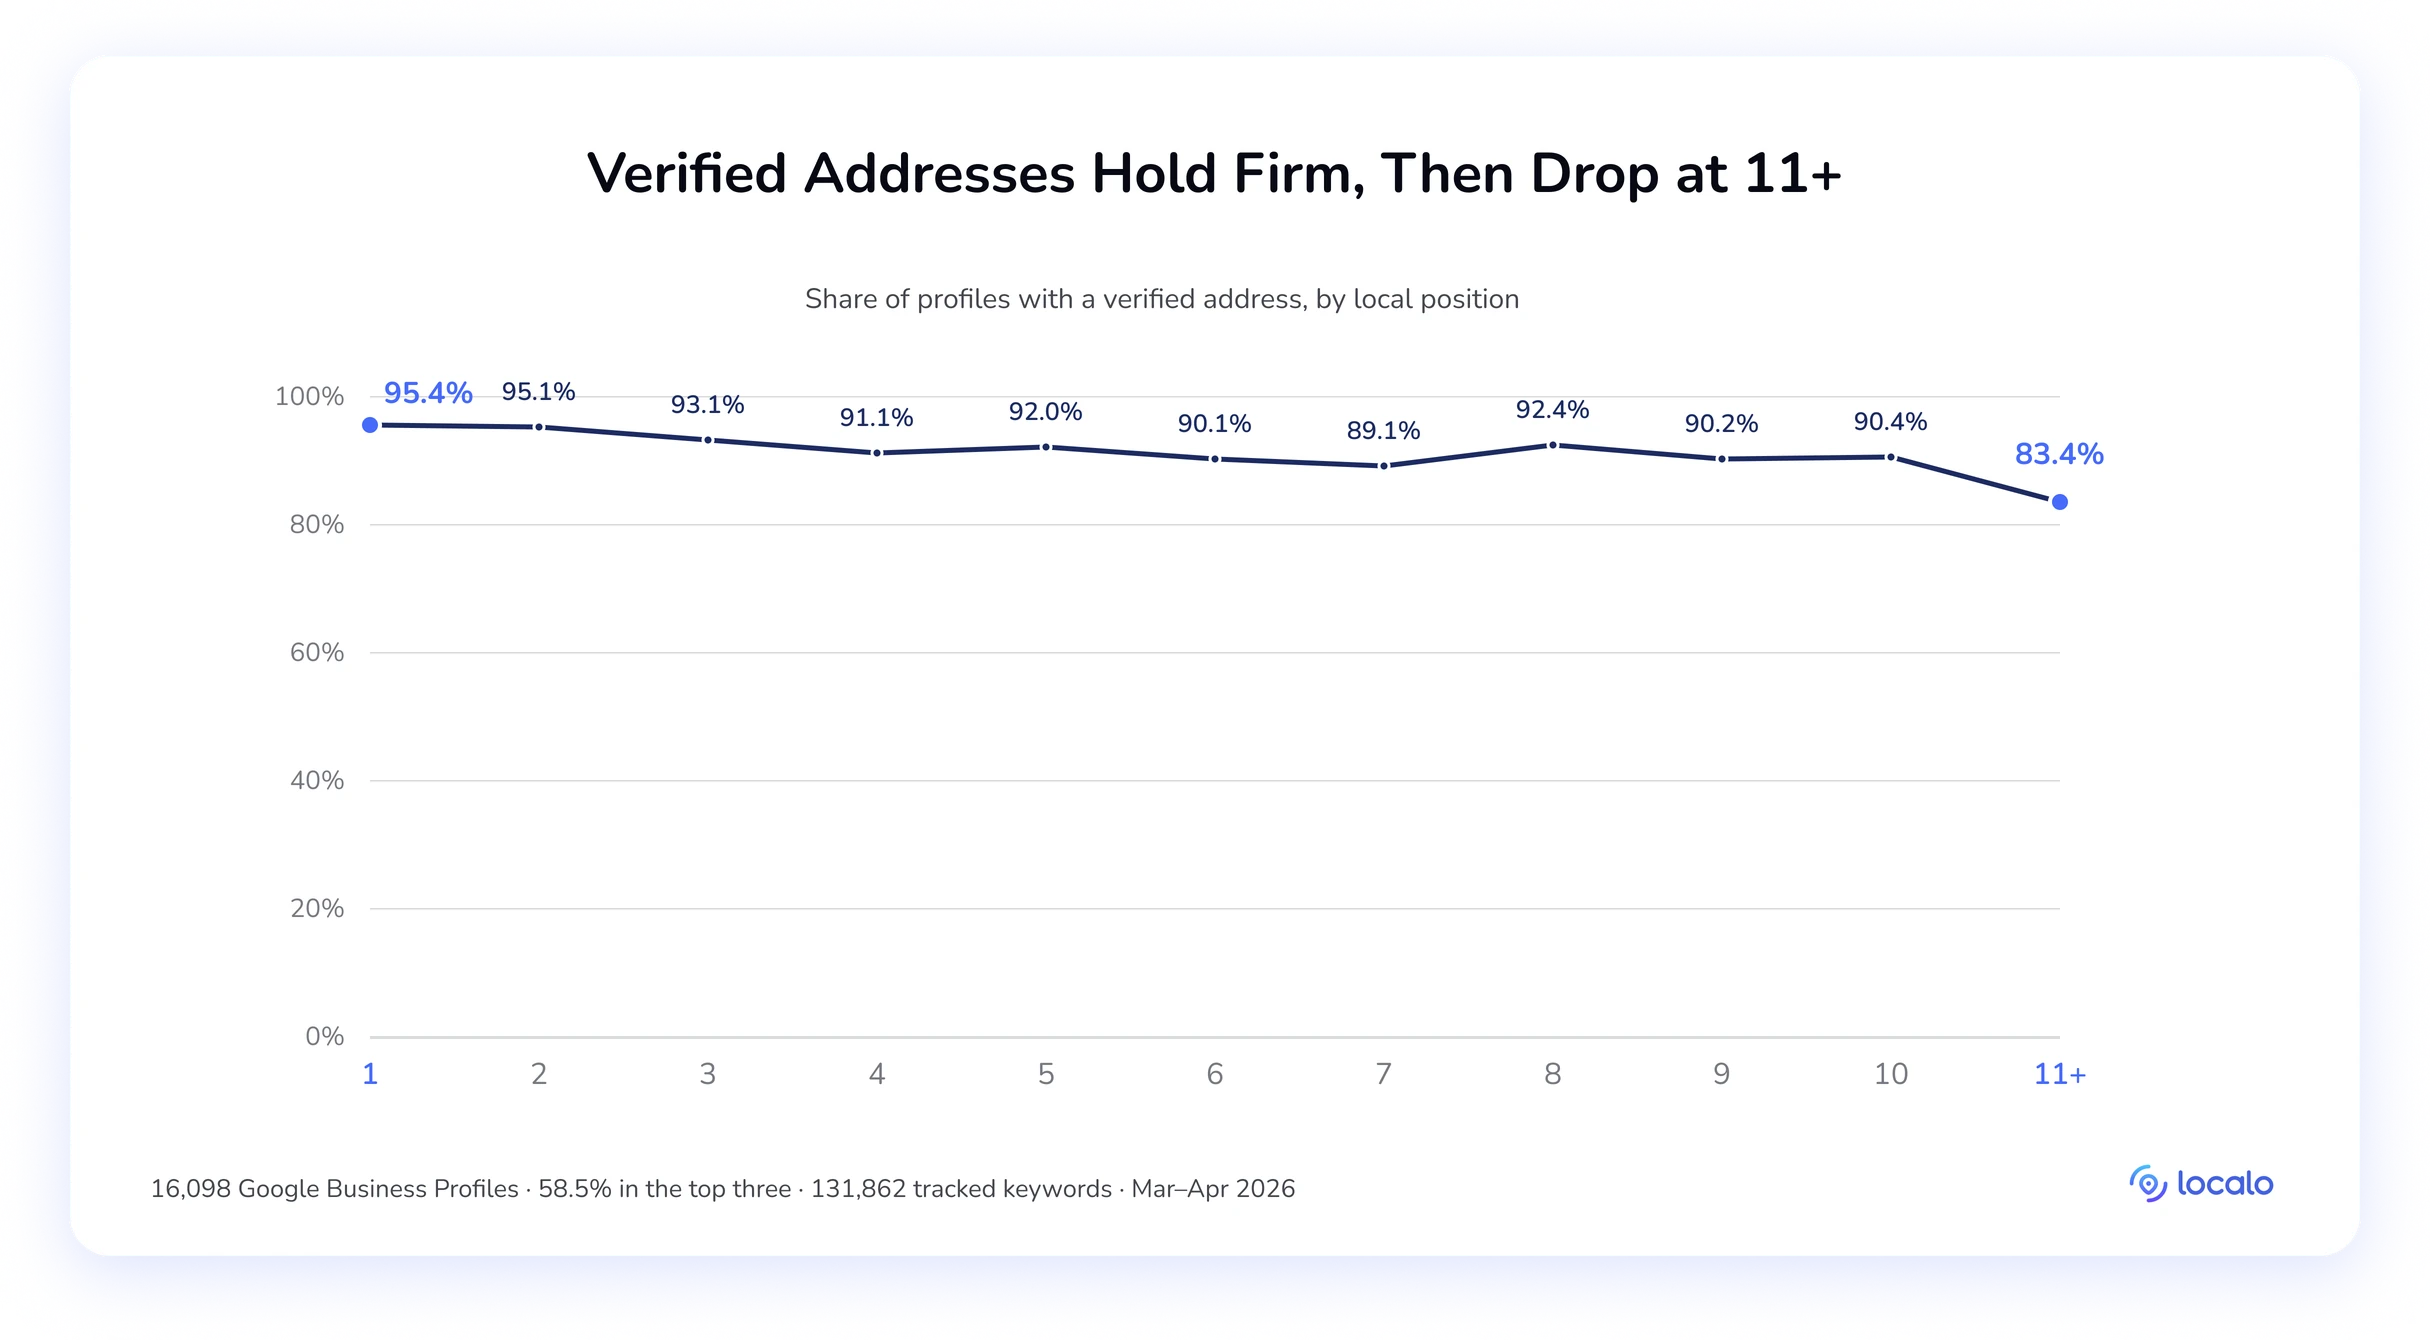
Put the other way: 16.6% of profiles at #11+ have no verified address, against 4.6% at #1, nearly four times the rate. At 7.7 points, the grouped gap between 1–3 and 11–20 is the widest of the presence factors in this study, ahead of social links (7.1pp), posts (6.4pp), description (4.5pp) and website (2.5pp), and second only to carrying at least one additional category (8.9pp).
If a business operates across a service area rather than a fixed location, define the service area instead of listing a street address. If a business has a physical location that customers visit, verify and display it.
🔎 Key takeaway:
It’s the widest single gap in the baseline set. If your client’s a service-area business, define the service area properly. And if verification is what’s blocking it, treat that as the priority; at #11+ it’s one of the two widest completeness gaps left to close, alongside missing categories.
Title & keywords
Title length clearly correlates with position. But it’s one of the few factors you can’t act on, which is why it sits here rather than among the movers: Google prohibits adding keywords, locations, or slogans to a business name, so the only title available to you is the client’s real one. What the correlation reflects is that some businesses are simply named more descriptively than others: “Johnson Family Dentistry and Orthodontics” against “Johnson’s”.
| Position groups | 1–3 | 4–10 | 11–20 |
|---|---|---|---|
| Avg. no. of words in the title | 6.58 | 6.07 | 5.86 |
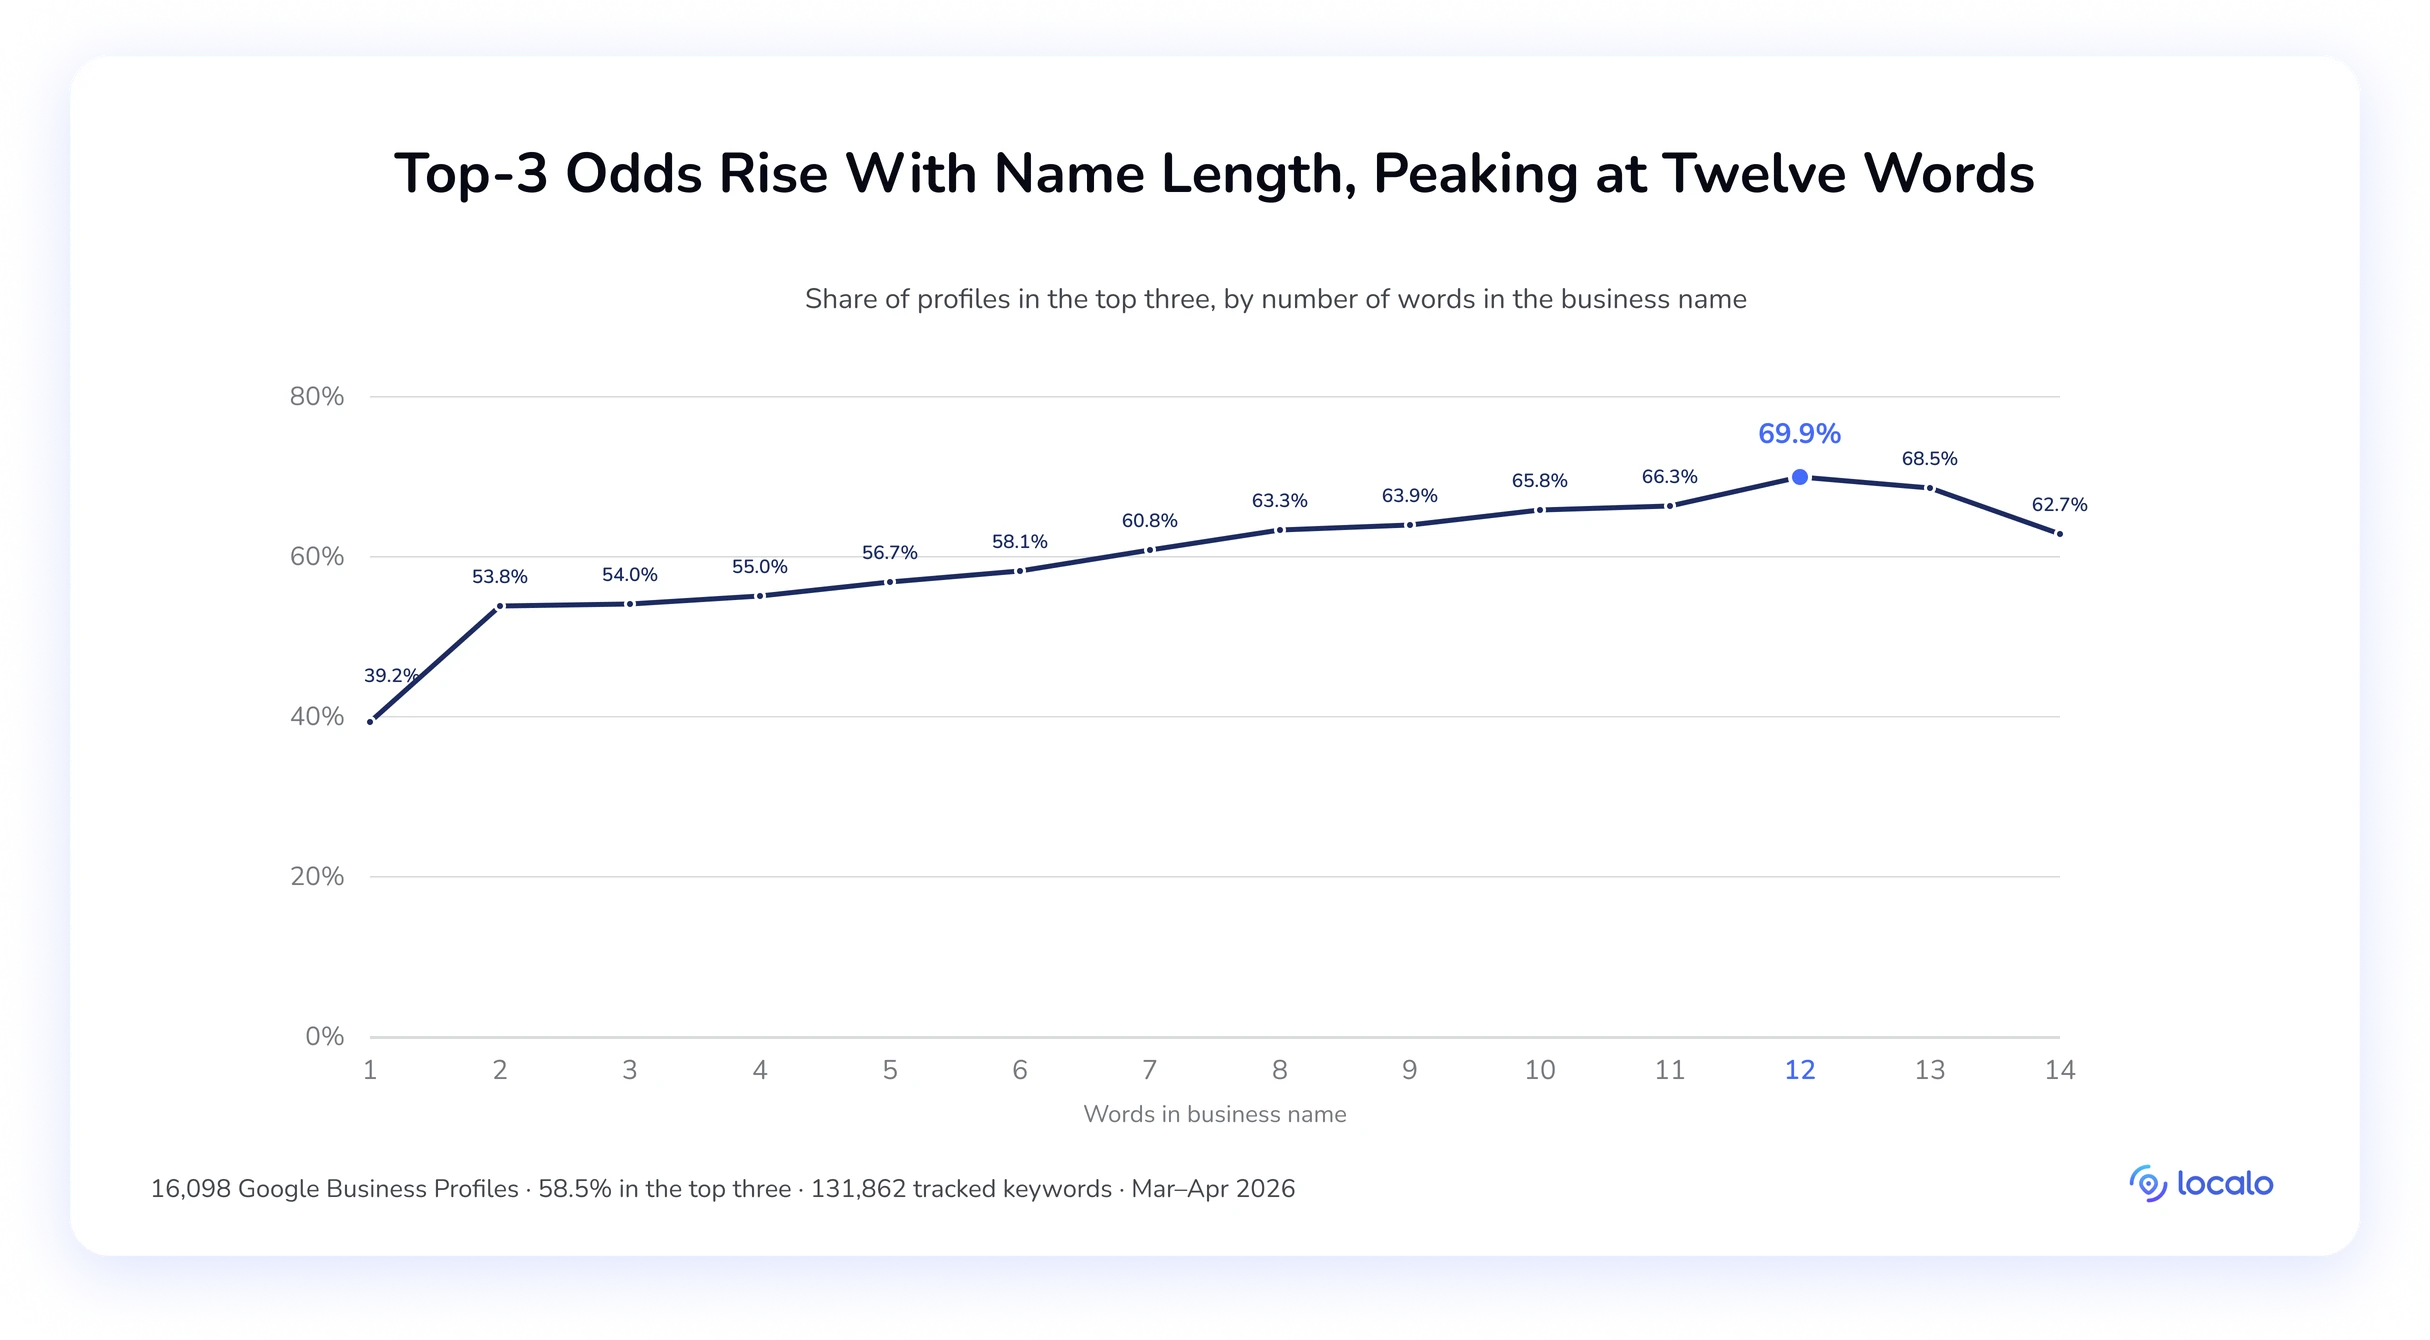
The word-count curve is steep. One-word titles rank top-three 39.2% of the time; by six words it’s 58.1%, by ten 65.8%, and it peaks at twelve words with 69.9%. Then it turns: 68.5% at thirteen words, 62.7% at fourteen. That’s a 30-point spread across the range, wider than most of the factors you can control.
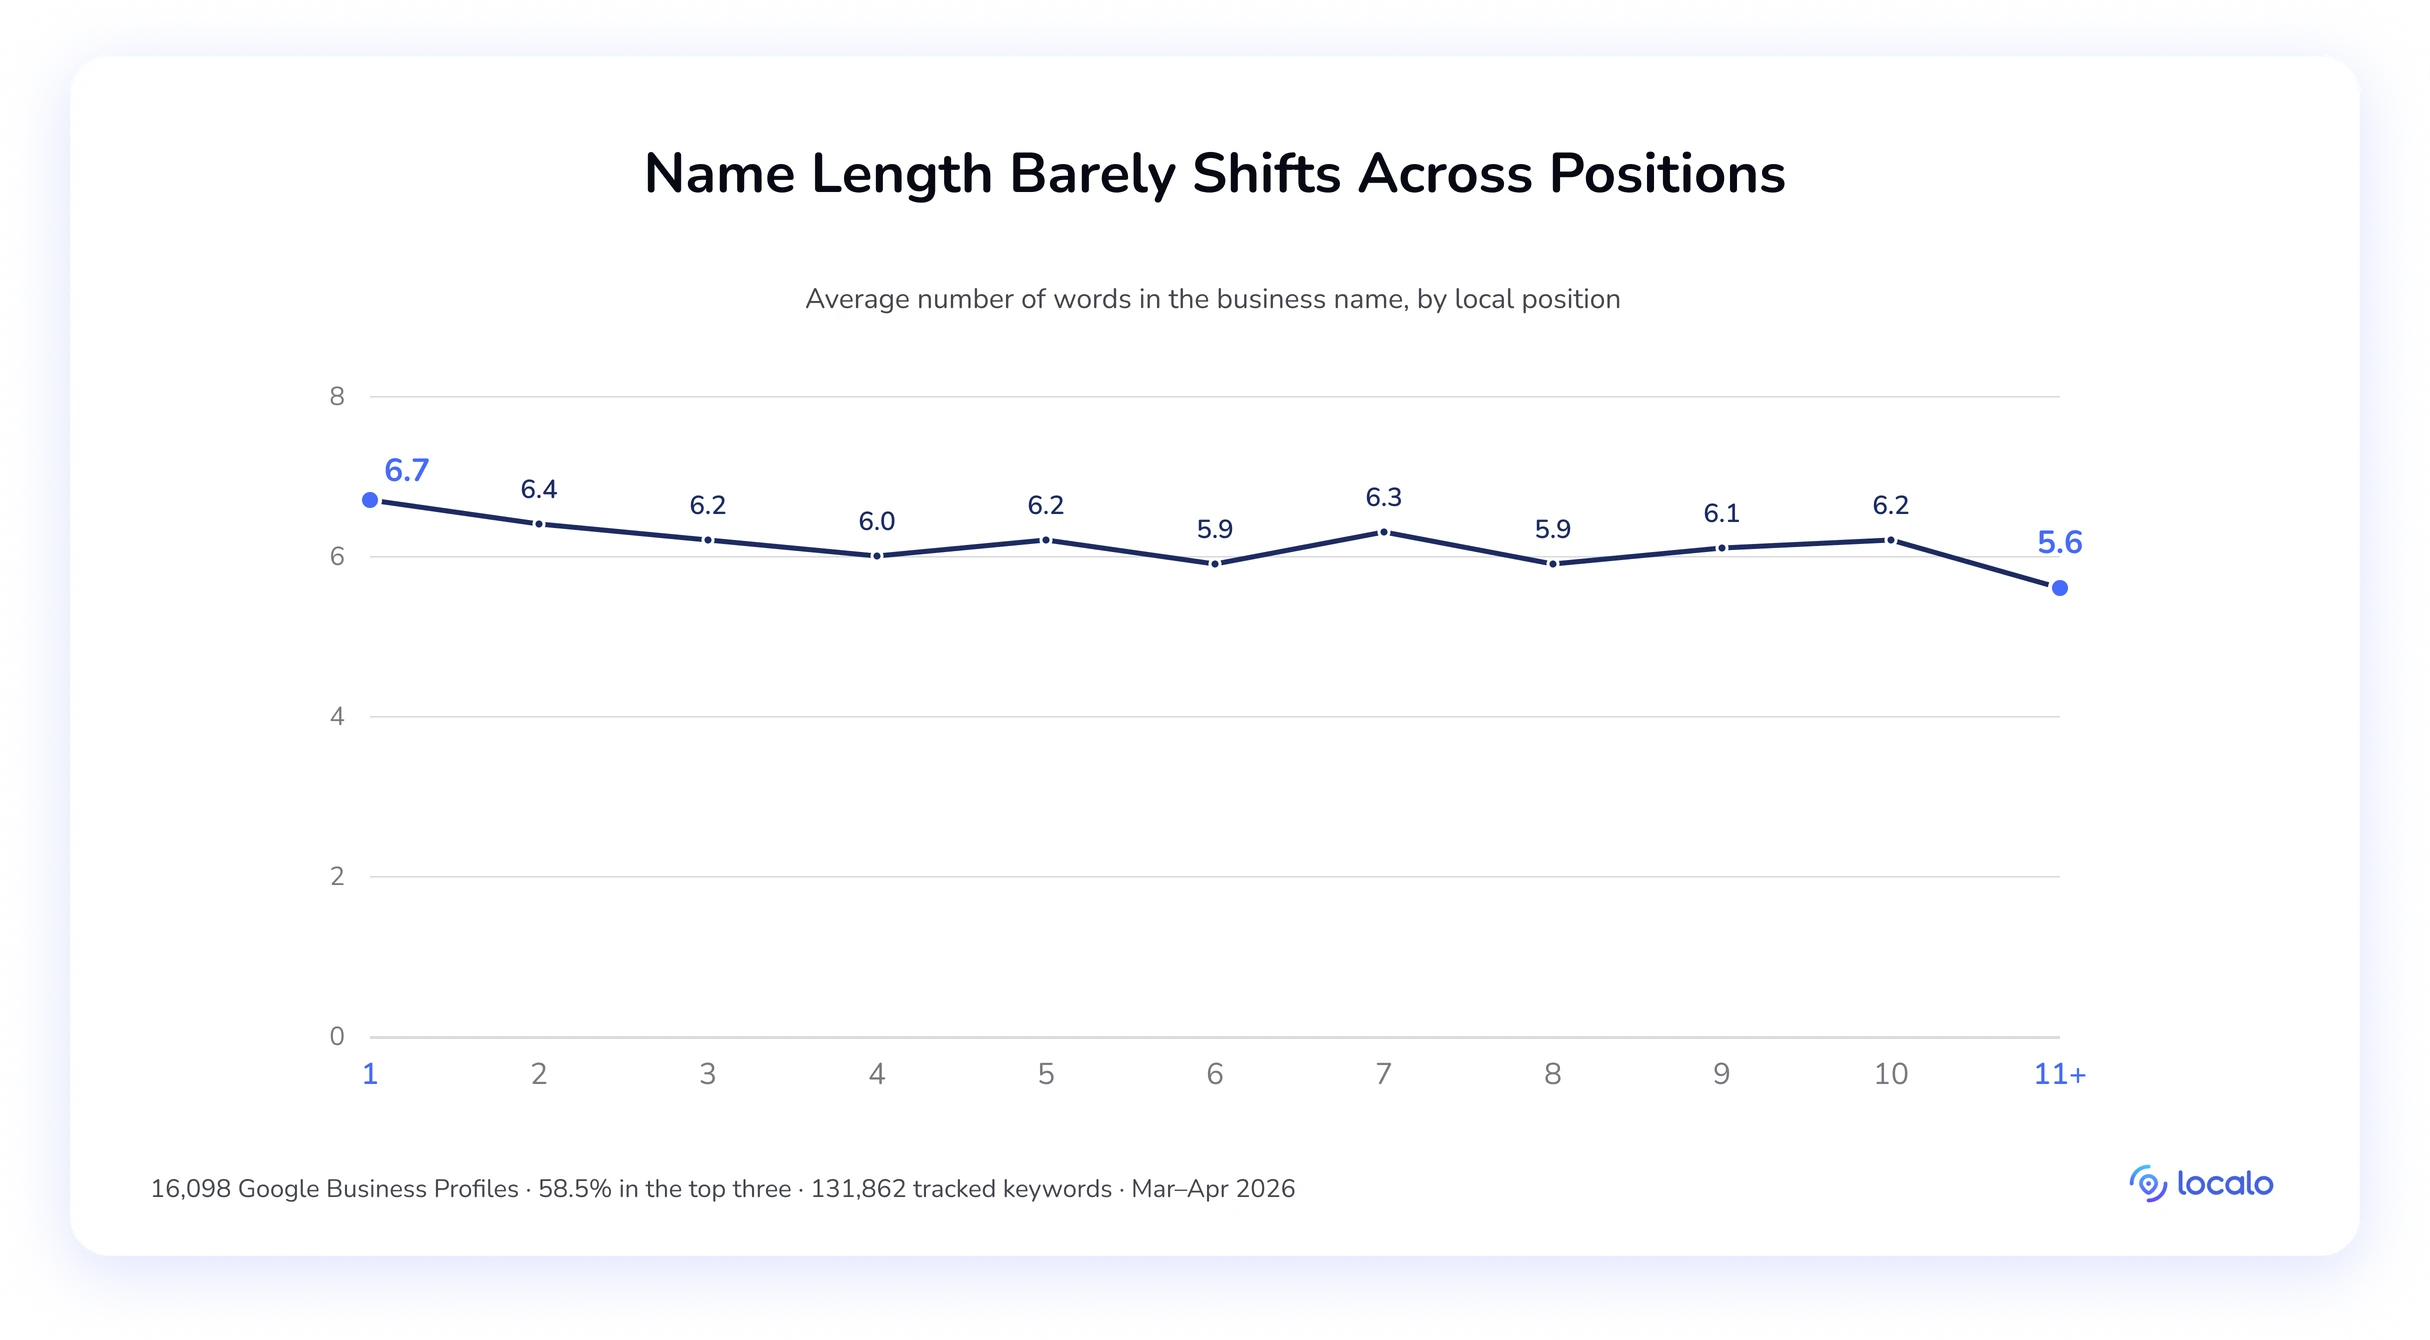
Two things say effectiveness is more nuanced than just the title’s length. Position by position, the averages run 6.7 words at #1 down to 5.6 at #11+, but the curve wobbles on the way, with #7 averaging 6.3 words against #4’s 6.0.
And what we’ll get to in the 131K tracked-keyword analysis below is that category keywords in titles barely move across the groups: around 19–20% have an exact match and roughly 50% a broad one, whether they rank first or twentieth. Matching a profile’s tracked search keywords against its title by word stem does correlate with a +4pp lift, but that argues for having an accurately descriptive legal name, not for editing one. The dip at thirteen and fourteen words may be profiles that padded and got caught; our data can’t establish that, so we won’t claim it.
🔎 Key takeaway:
Use the client’s full legal name and stop there. Adding descriptive terms risks suspension for a gain the data caps at +4pp. This is a correlation to understand, not a lever to pull.
Are keywords important Google Business Profile ranking factors?
SEO experts have argued for years about whether keywords belong among the top local search ranking factors [Whitespark, 2026; Sterling Sky, 2023]. So we tested it directly: 131,862 local search keywords that businesses were actively tracking, matched against each profile’s title, description, review text, and last ten posts, using five matching methods: exact phrase, all words, any word, and stem matching on four- and five-character roots.
Stemming matters because Google doesn’t need exact strings: a keyword containing “plumbing” can match “plumber” in a title.
| Profile area | Strongest match type | Effect | Weakest match type | Effect |
|---|---|---|---|---|
| Description | stem-4, any word | +4.6pp | all words | +0.5pp |
| Title | stem-5, all words | +4.0pp | any word | +2.3pp |
| Posts | stem-4, any word | +1.8pp | any word | +0.2pp |
| Reviews | exact phrase | +1.6pp | any word | −1.0pp |
Two places produce an effect worth naming, and only two. Descriptions lead, and the trigger is a four-character word root appearing anywhere in the text, not the exact phrase, which manages only +2.3pp. Google reads a description as a semantic bag: roots register, exact strings aren’t required. Titles come second on five-character stems, ahead of exact matching at +3.6pp.
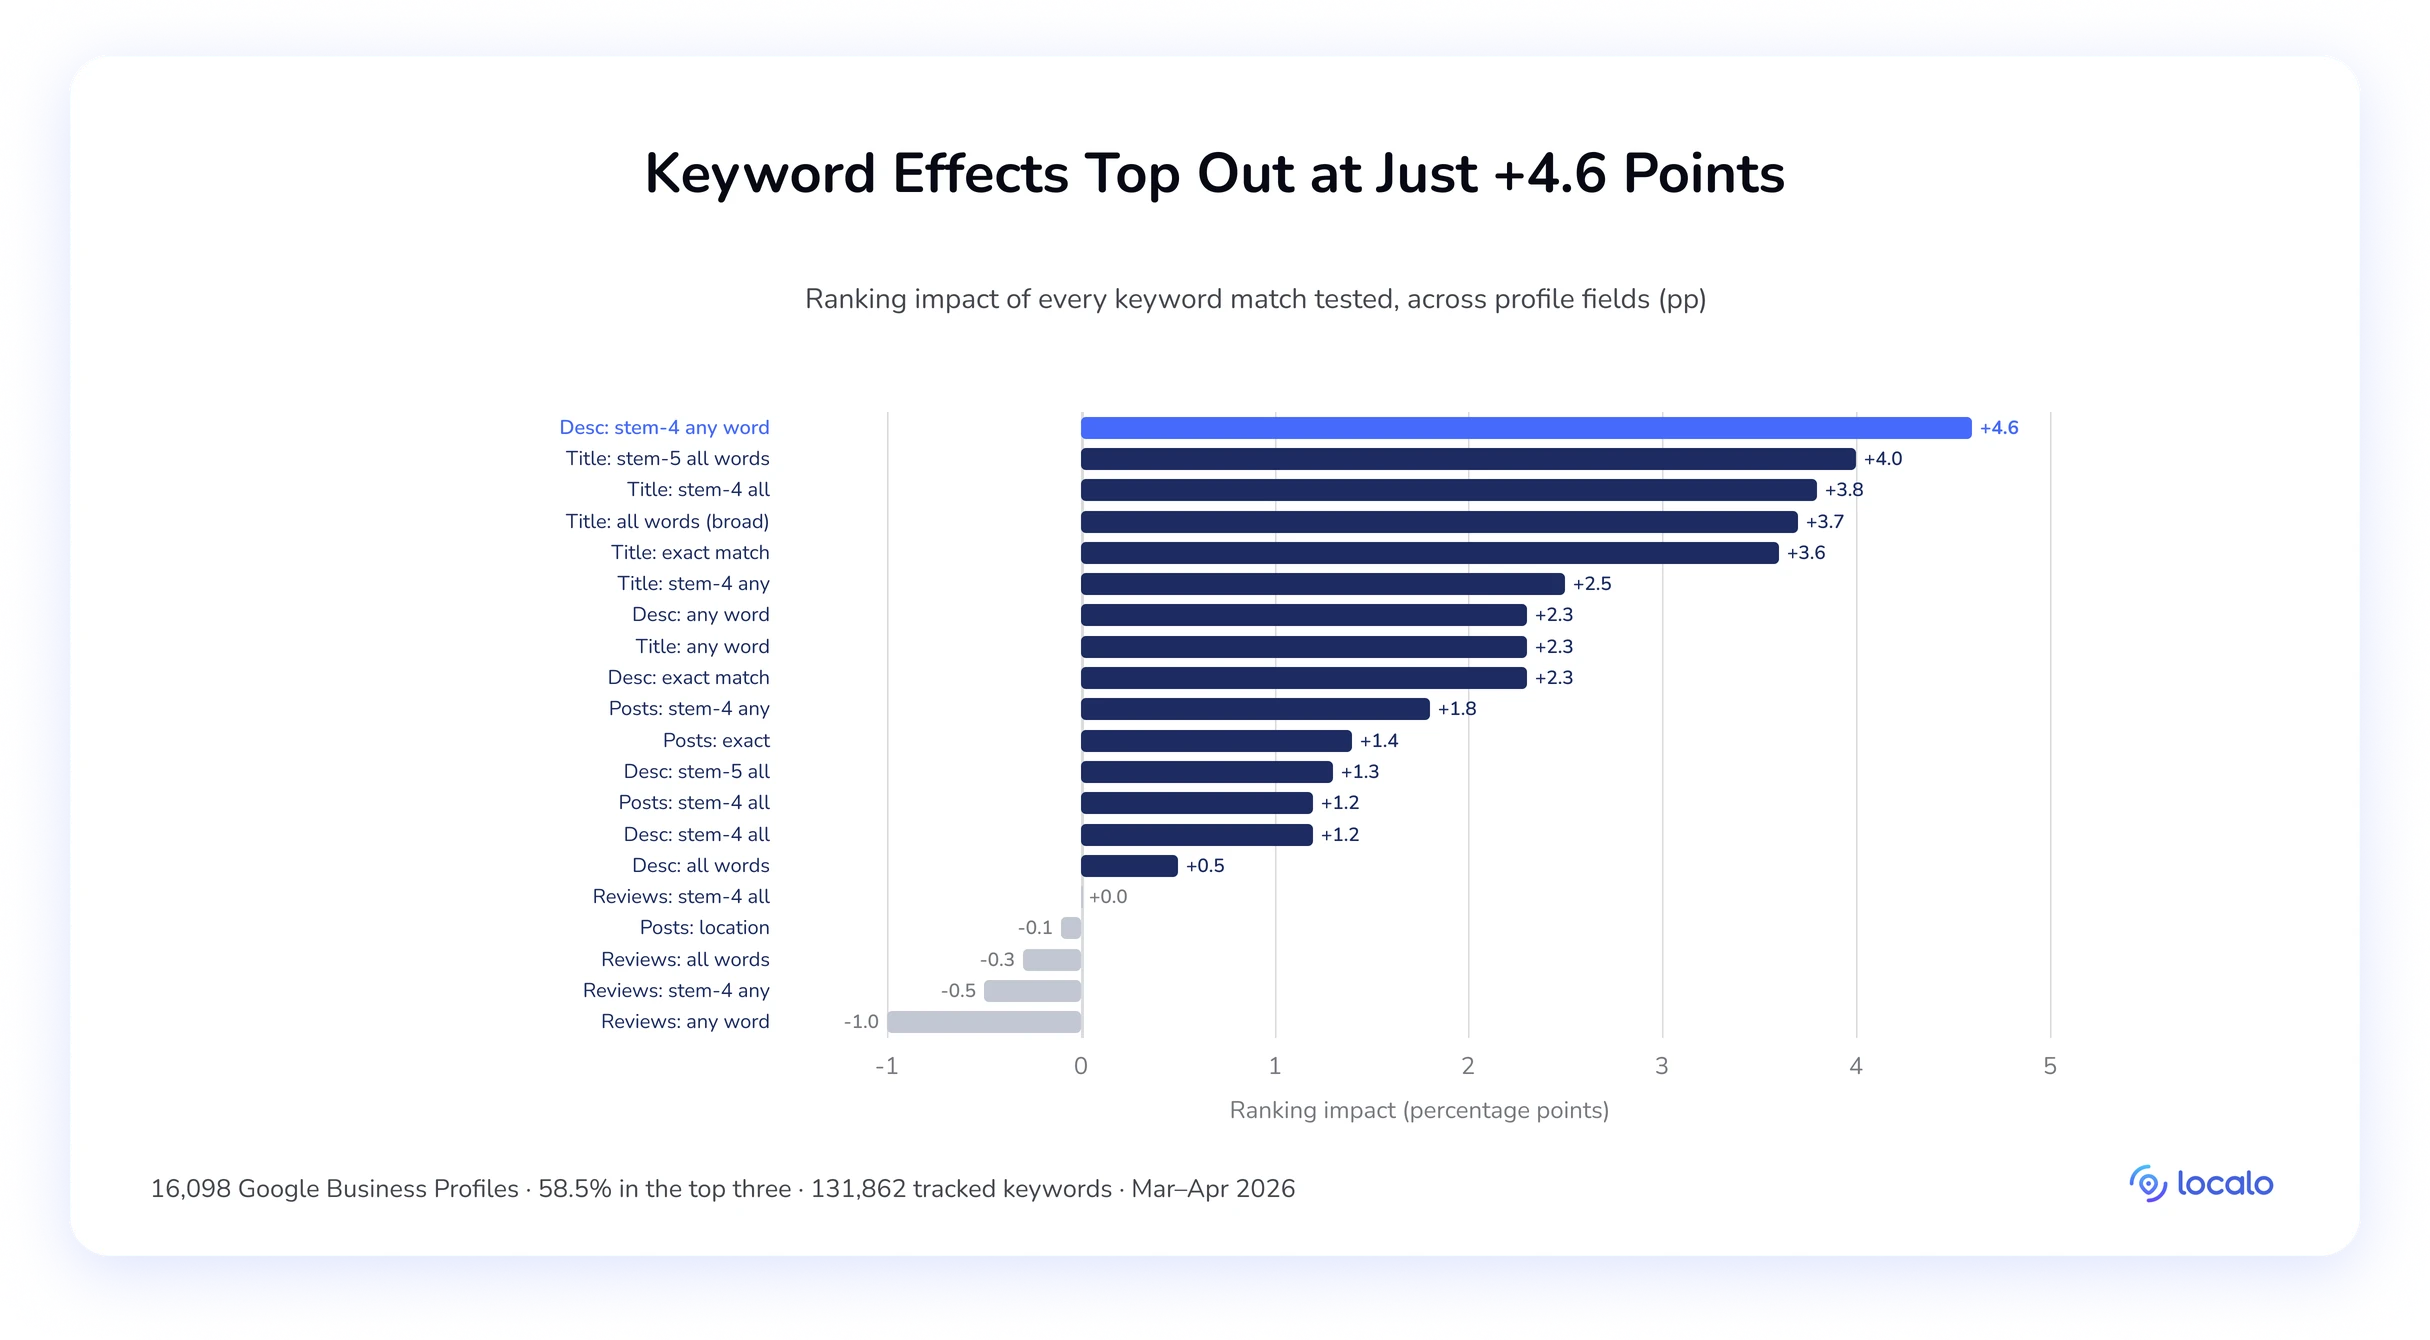
Reviews come closest to a null: three of the five methods run negative and all five average to roughly zero. Nothing in the data suggests you can coach your way to a ranking. Posts are barely better, and location keywords in post text land at −0.1pp, the only negative reading posts produce.
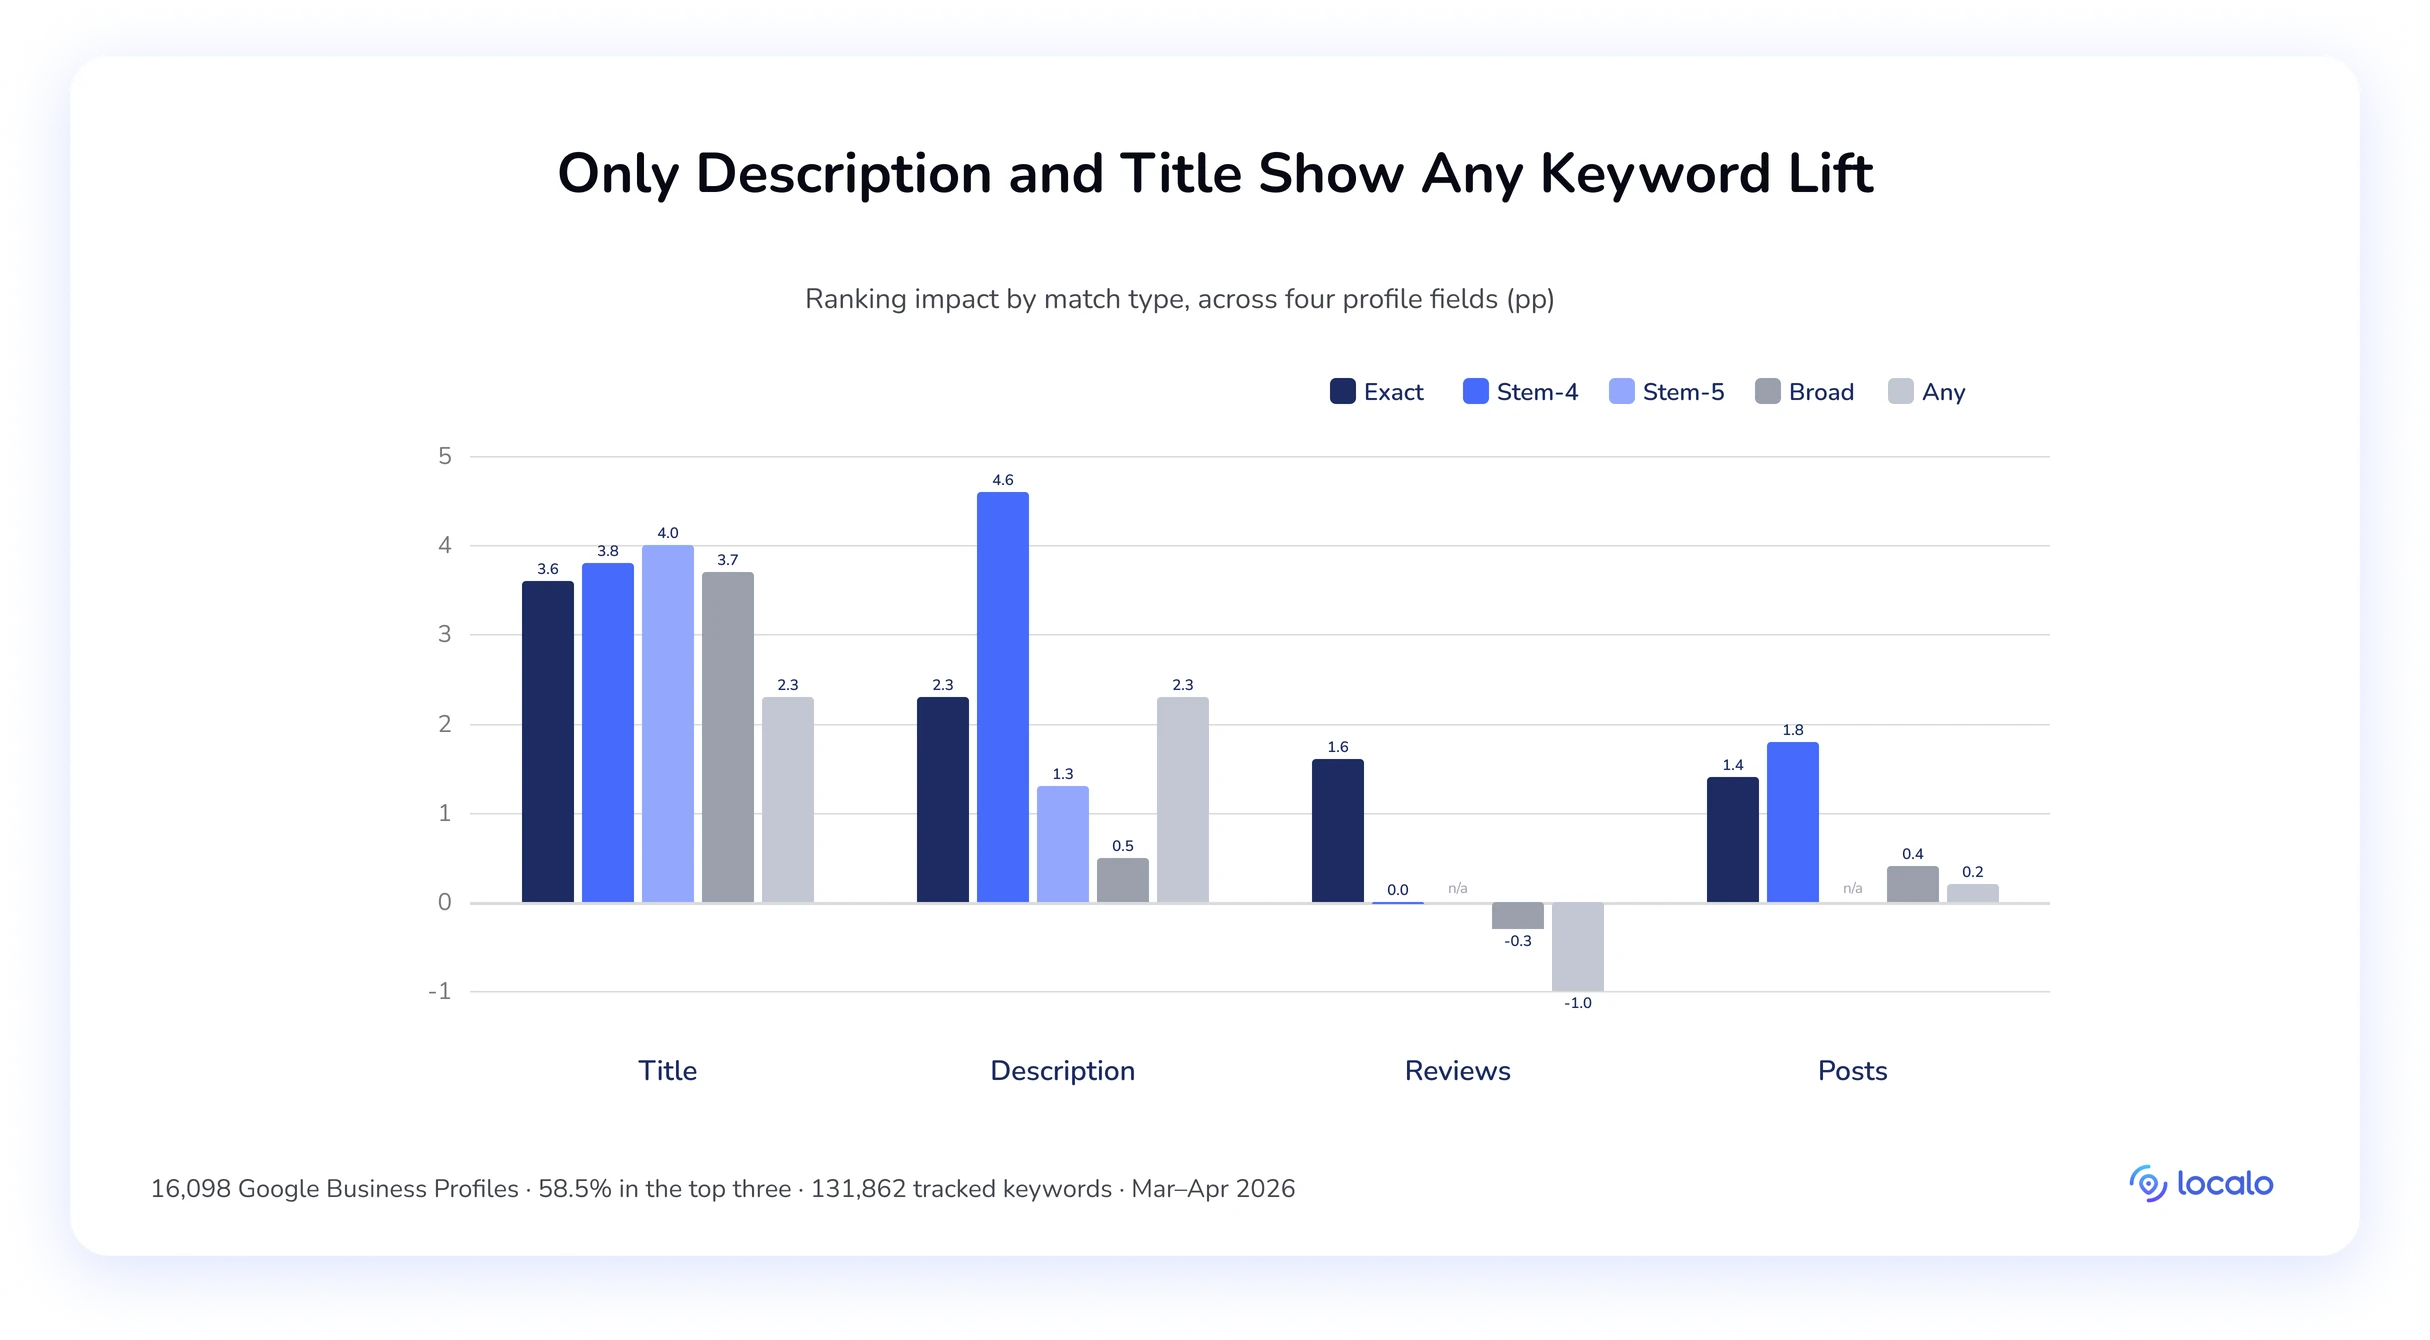
Now the scale. The strongest keyword effect in the study, +4.6pp, is smaller than the single step from 21–50 reviews to 101–200, which is worth +11.8pp on its own.
🔎 Key takeaway:
Write a natural, accurate description and let stemming do the work. That’s the ceiling. Never coach review wording and don’t focus on optimizing posts for keywords. Then put 95% of the hours into reviews and photos, which are 5–10 times more impactful.
Local search ranking factors that don’t hold up
Now that you know which Google My Business ranking factors work, let’s cover the ones that don’t. What makes these non-factors isn’t that the gaps are small (some aren’t) but that the curves have no direction: the brackets rise, then dip, then rise again, so there’s nothing to aim at. Understanding that will help you skip tasks that consume time and provide no tangible results to your clients for you to report on.
Busted: Review frequency must be steady
Local SEO experts often believe that Google prefers businesses gaining reviews at a steady pace. We’ve recently run a study on review velocity confirming that unusual pace (e.g., 100+ reviews/week) can be suspicious and lead to faster deletion.
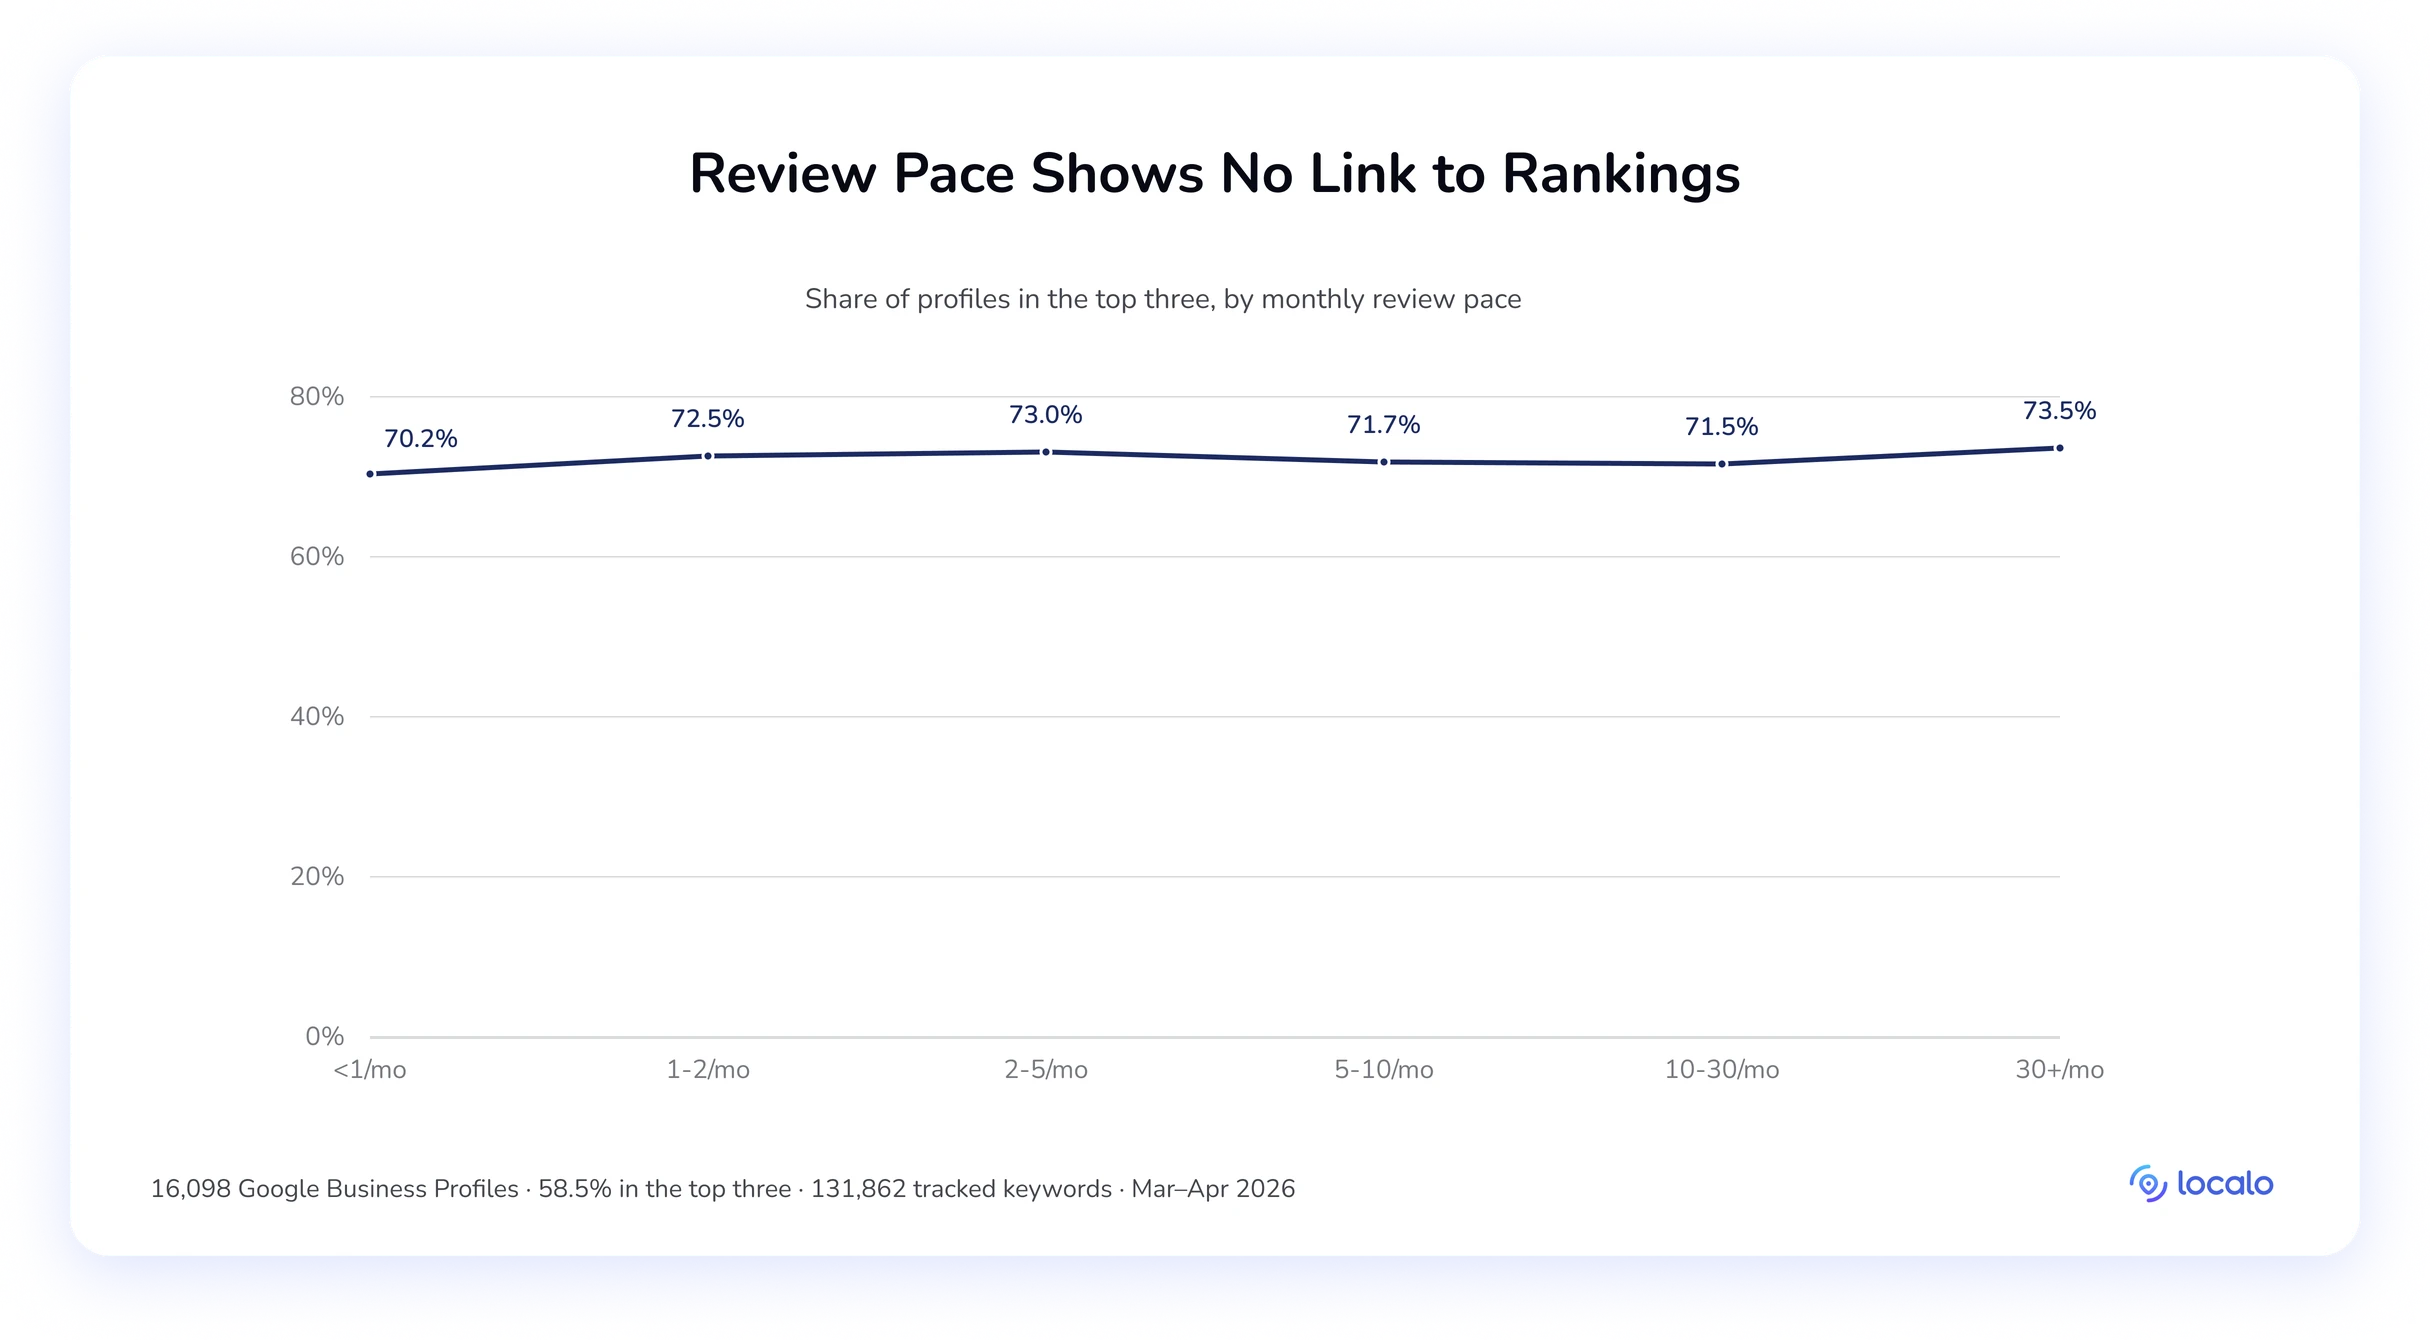
Now, we’ve looked at 16,098 businesses and calculated their monthly review rates to see if there’s a connection between the pace of review acquisition and local search ranking. The results: the curve has no direction.
Profiles earning under one review a month rank top-three 70.2% of the time. At 1–2 a month it’s 72.5%, at 2–5 it’s 73.0%, then it falls back to 71.7% at 5–10 and 71.5% at 10–30, before rising to 73.5% at 30+. Best and worst sit 3.3 points apart, and the readings arrive out of order; a dip at 5–10 and 10–30 sits between the second-highest bracket in the middle of the range and the highest at the very top. There is no pace to aim for, because the ordering doesn’t hold.
🔎 Key takeaway:
Total review count is what matters, so drop the pacing strategies. One caveat, and it’s a different risk: as our velocity study covers, a genuinely extreme burst can get reviews flagged and removed, which costs you count. That’s a filtering problem, not a ranking one.
Busted: Longer reviews are better
The theory is reasonable: longer reviews carry more context and more category language for Google to parse. So we measured average review length at every position, then sorted profiles by the actual length of the reviews they receive.
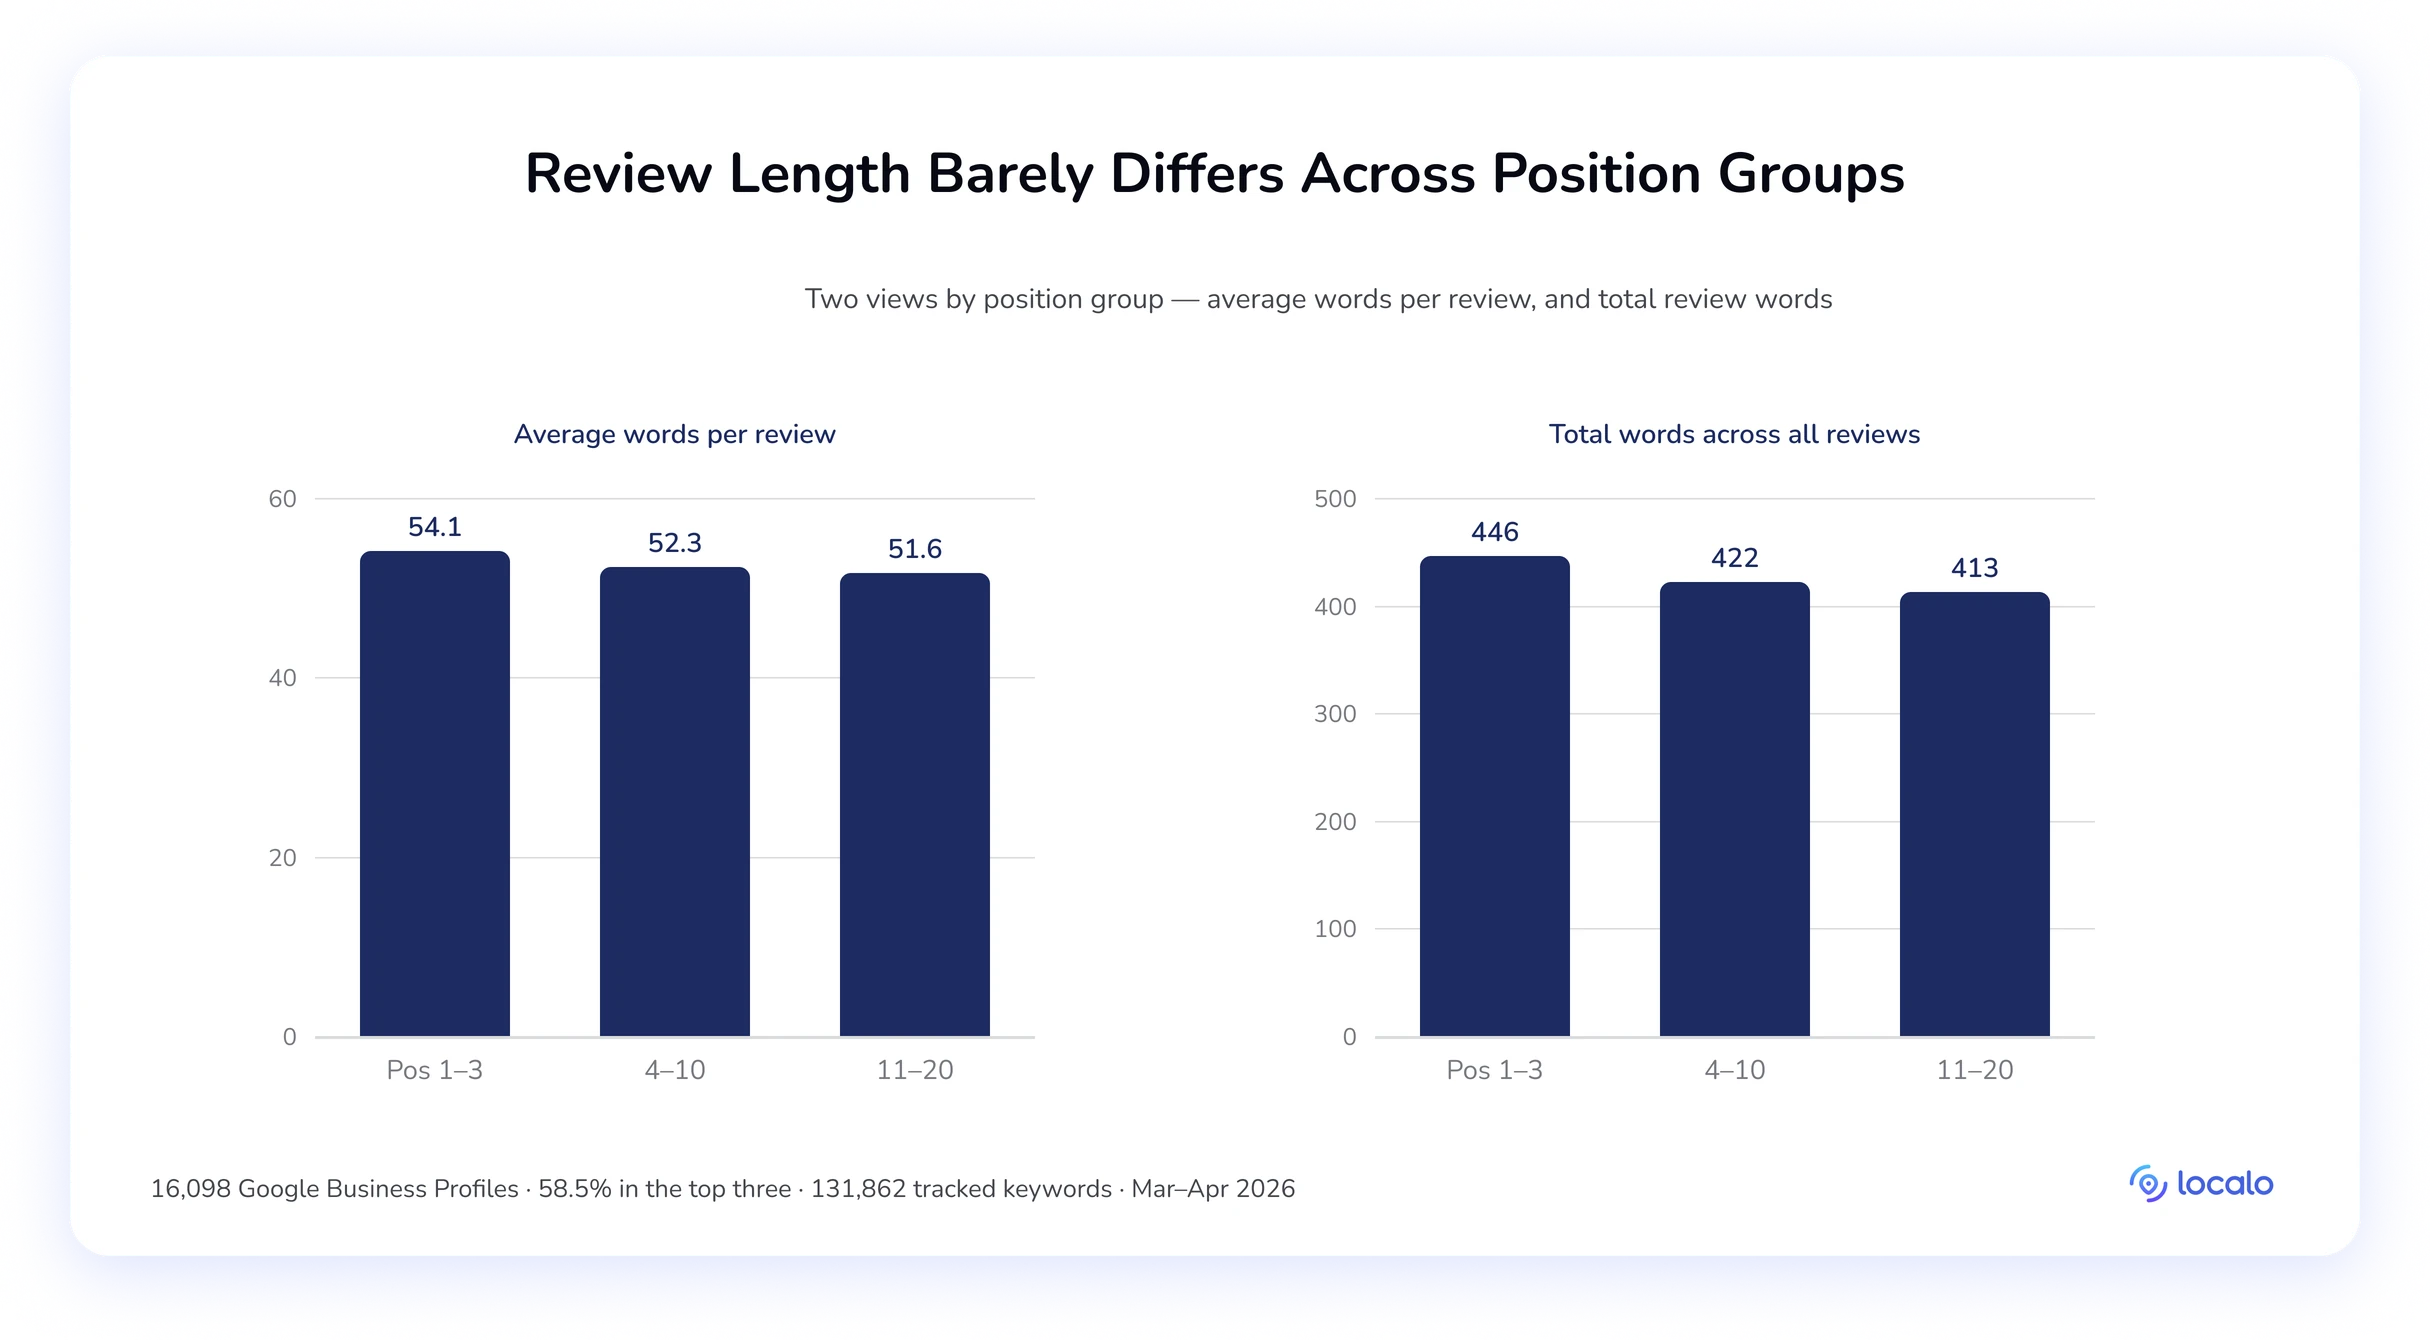
The results are nothing you can act on. Top-three profiles average 54.1 words per review against 51.6 at #11–20, a 2.5-word gap.
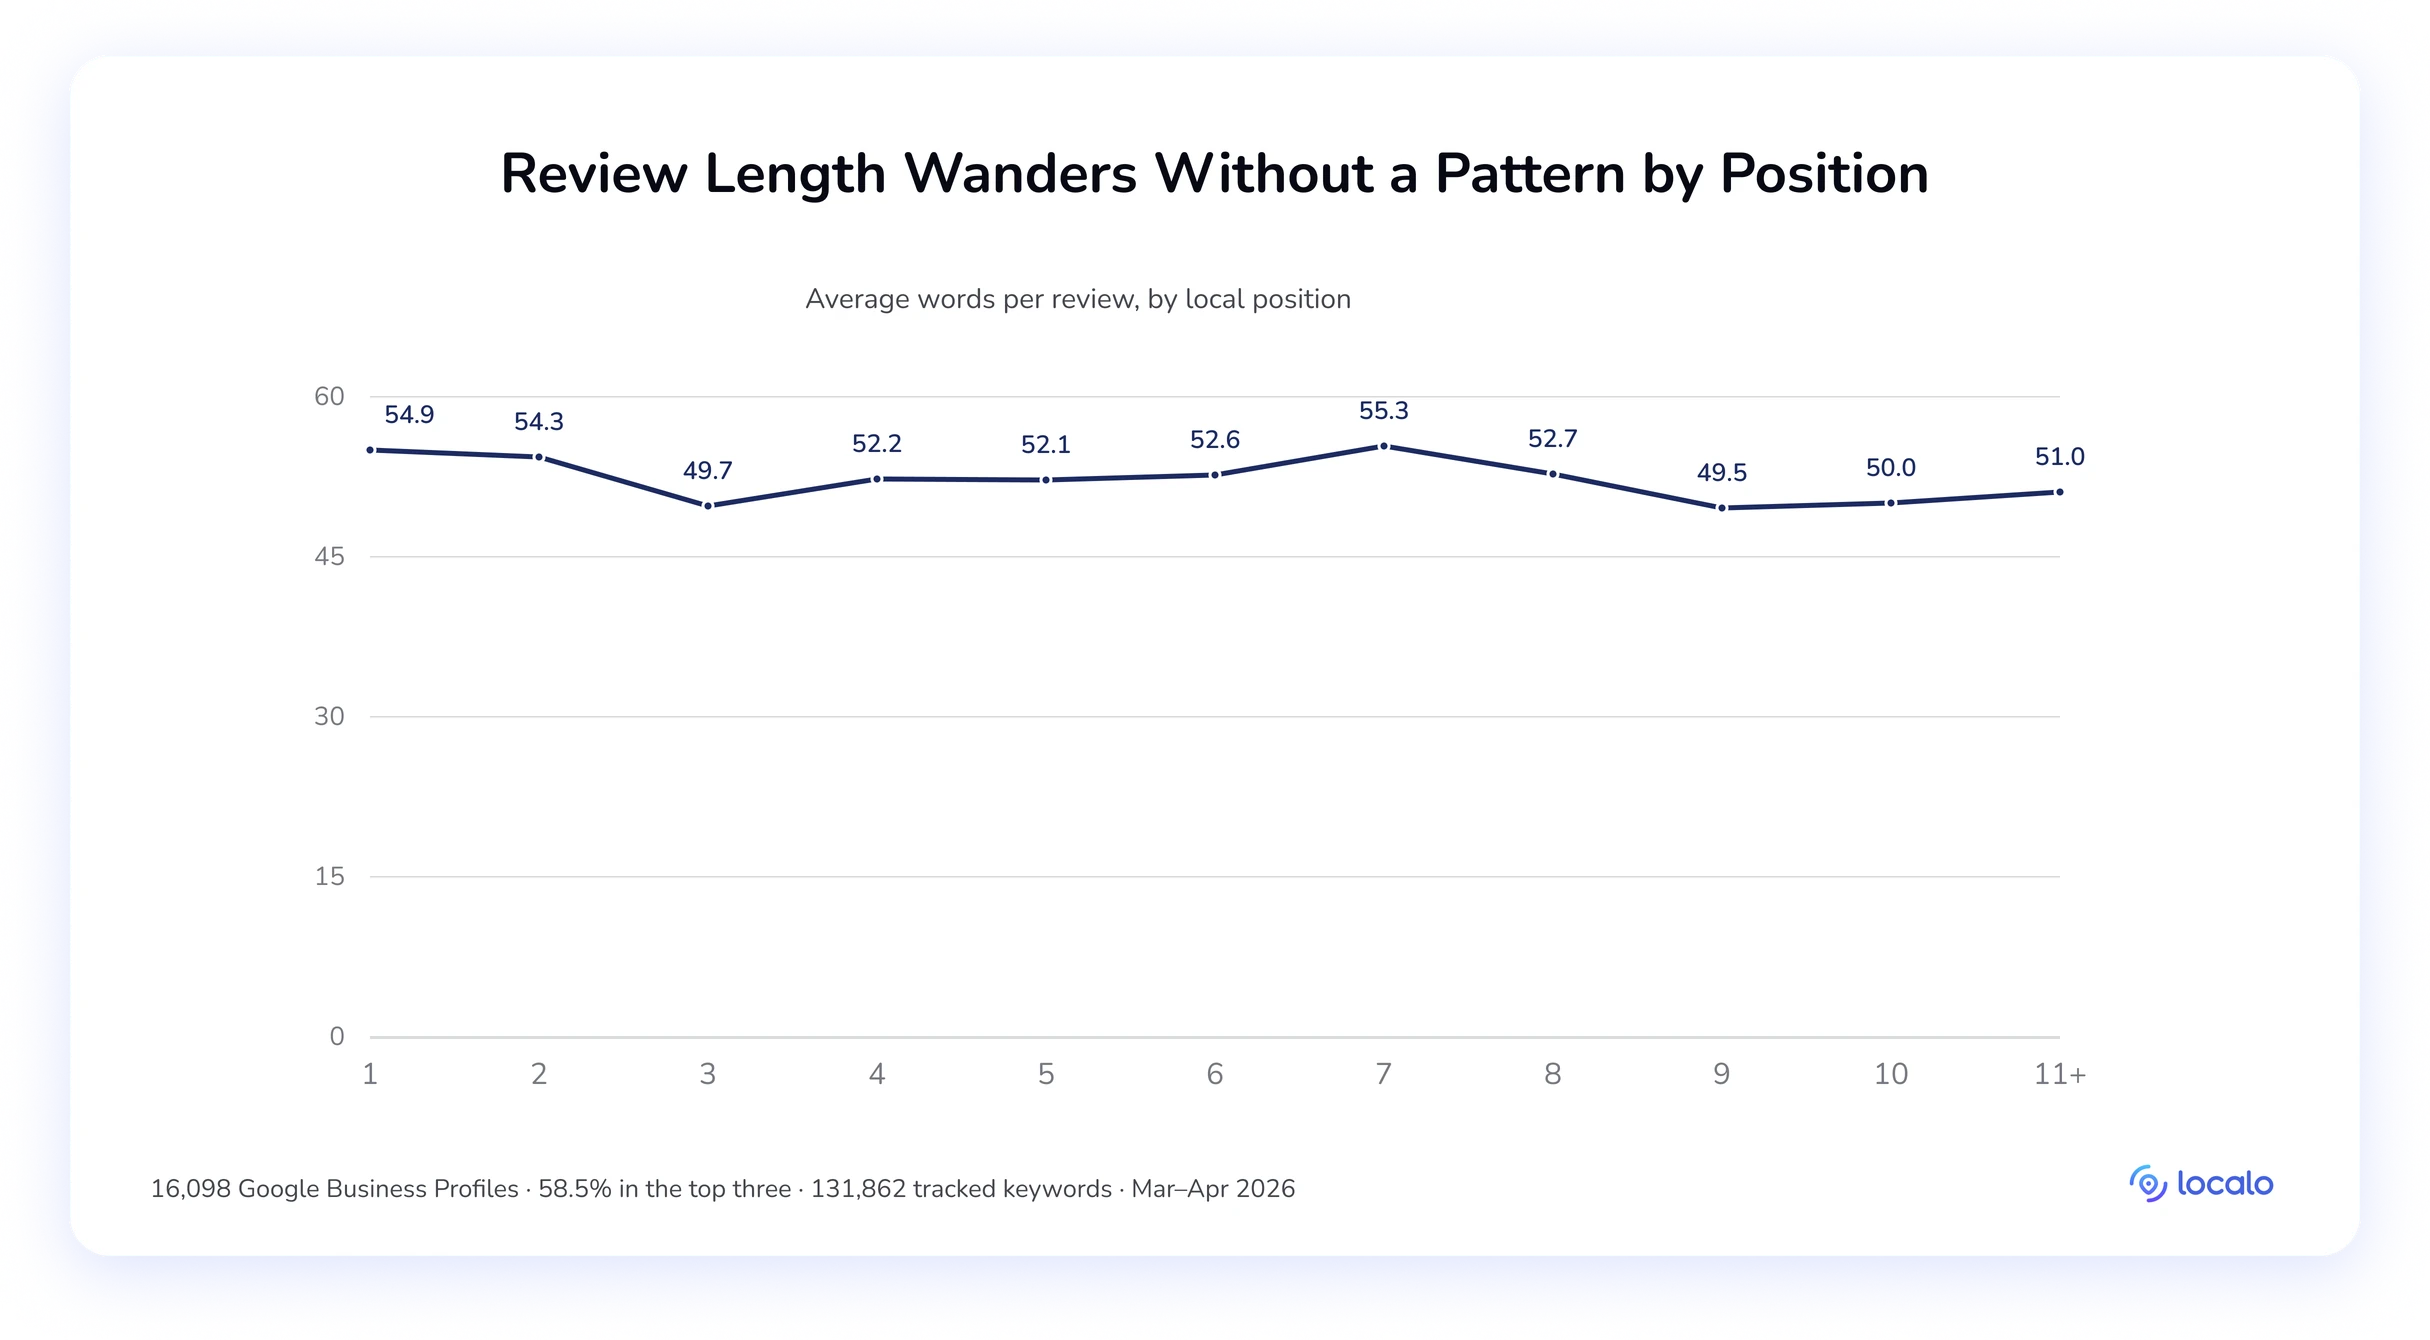
Position by position, the picture is the same, hovering around 52 words from #1 to #11+.
And sorting profiles by review length flattens it completely: 16–30 word reviews come with a 72.8% top-three rate, 31–50 words 72.6%, 51–75 words 71.0%, 76–100 words 70.6%. A 2.2-point band spanning everything from 16-word reviews to 100-word ones.
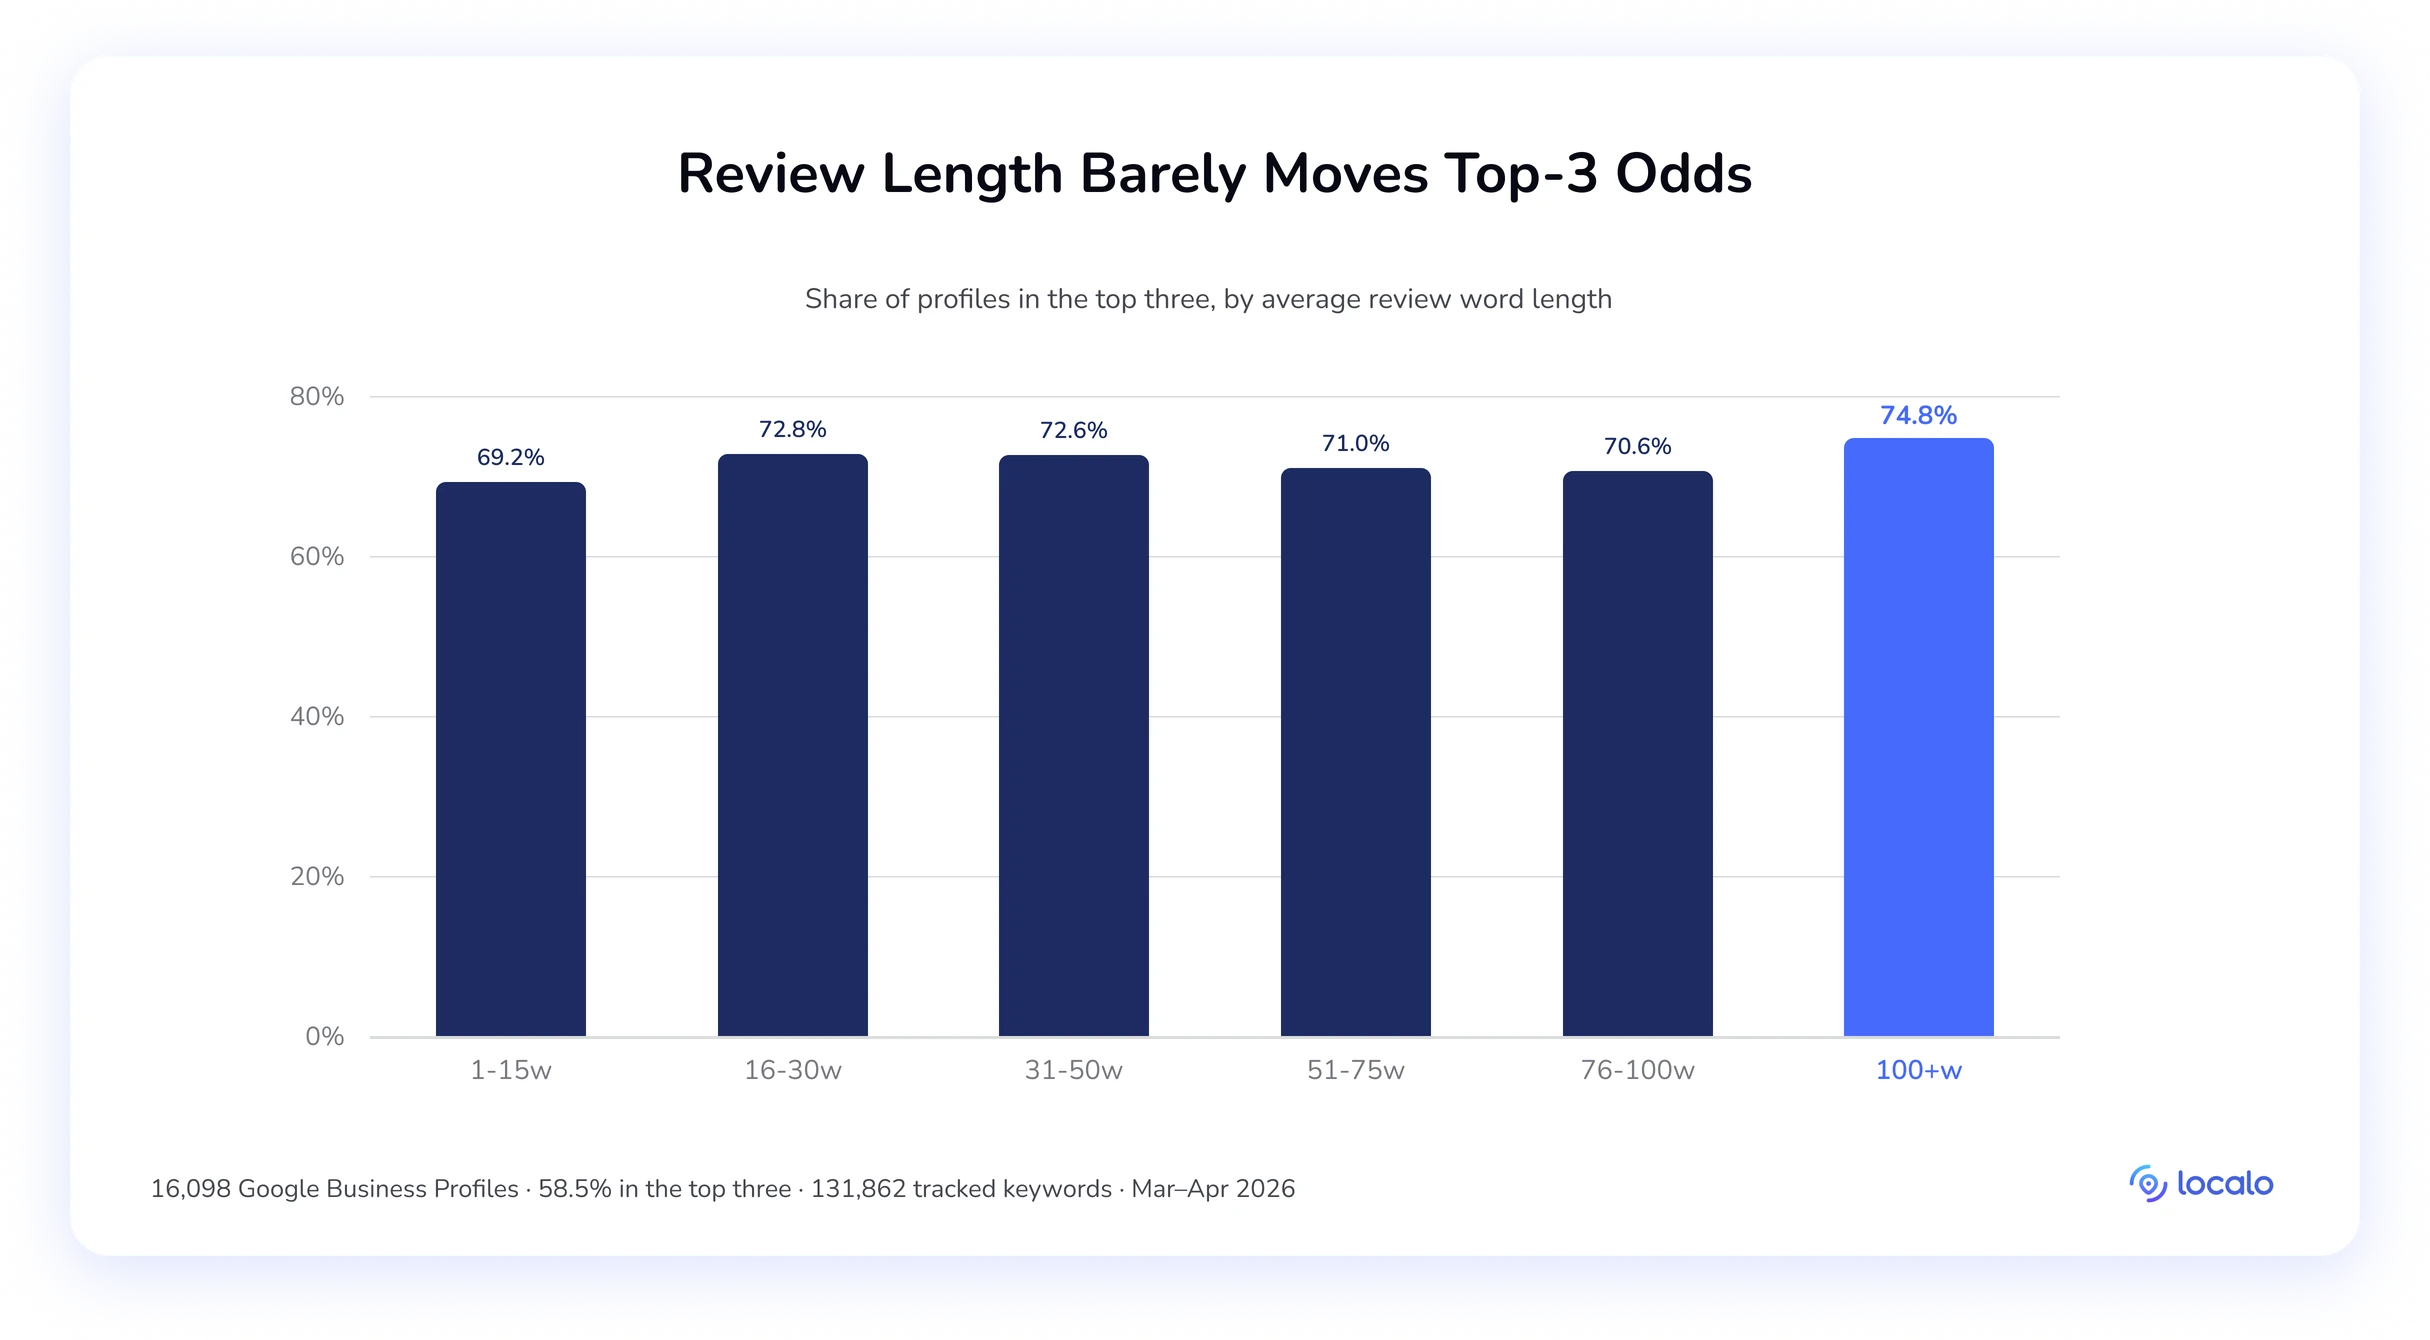
Only the extremes move: under 15 words drops to 69.2%, over 100 climbs to 74.8%, and that says more about which businesses attract essay-length reviews than about length doing any work.
🔎 Key takeaway:
Chase more reviews, not longer ones. And don’t try to steer what customers write: keywords in review text are one of the cleanest nulls in the dataset, as the keyword section above shows. Encourage genuine, detailed feedback because it builds the client’s reputation, not because it moves ranking.
Busted: Higher review response rate & length matter
Here’s where context is more important than bare numbers. Localo’s data shows lower-ranking businesses reply to reviews at a higher rate than top GBPs: positions #1–3 average a 73.4% reply rate against 76.7% at #11–20. The extremes run the same way: 50.2% of profiles at #11–20 reply to every single review, against 47.0% of top-three profiles, while 13.4% of top-three profiles reply to none at all, against 10.5% at #11–20.
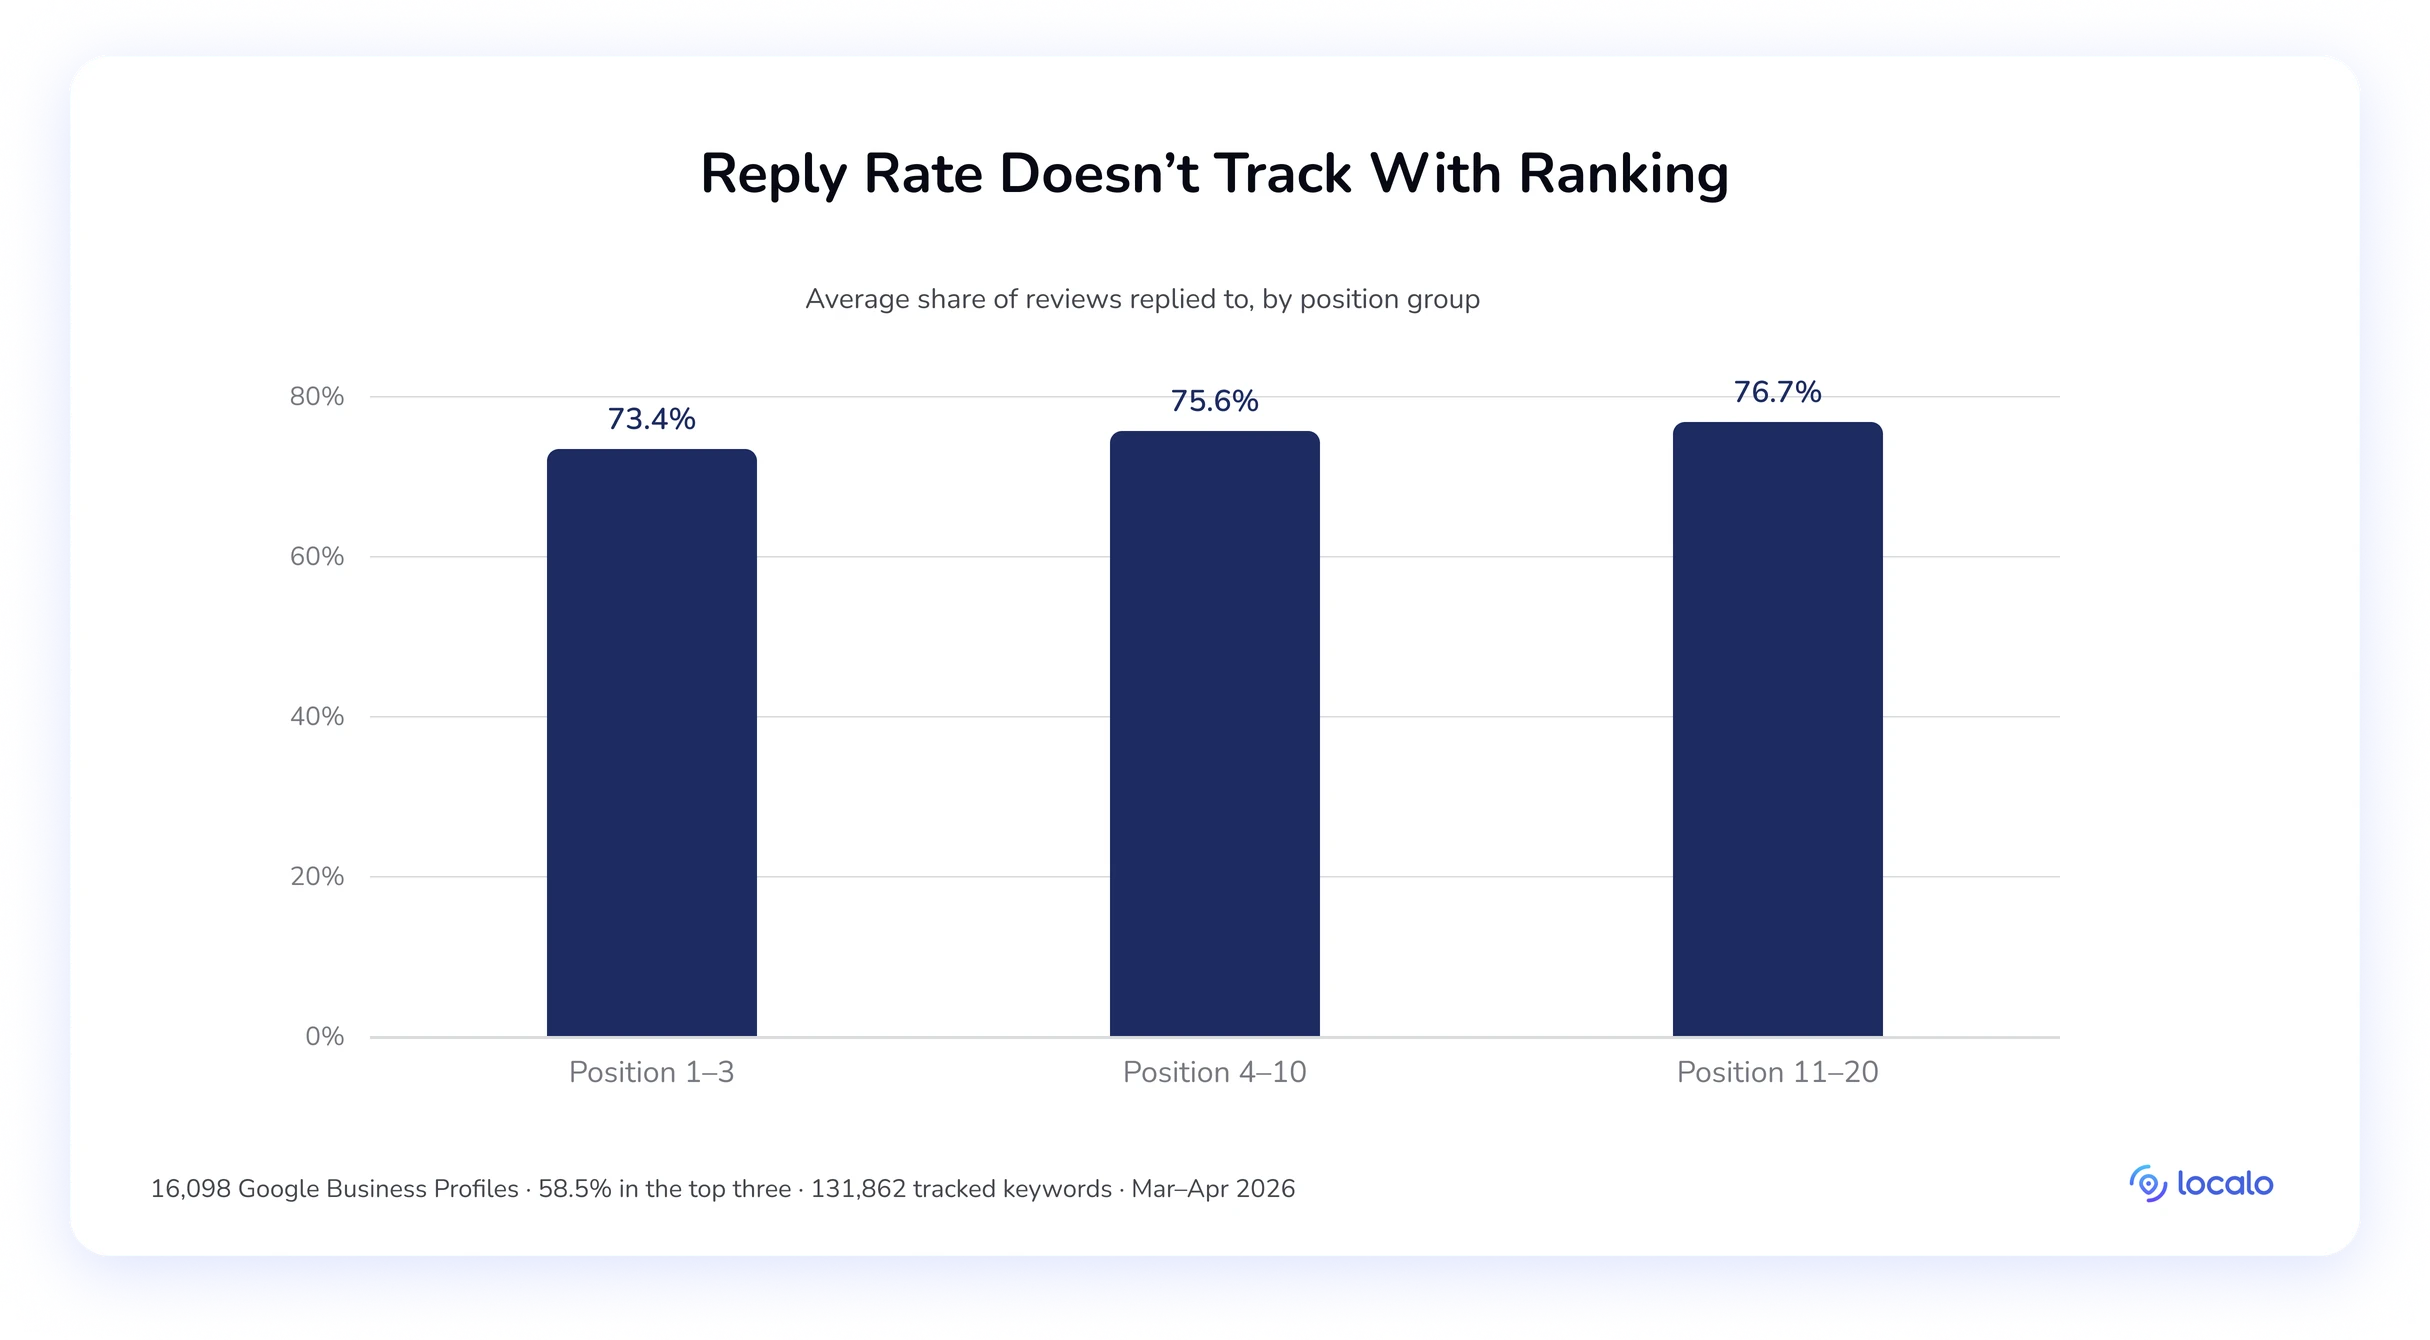
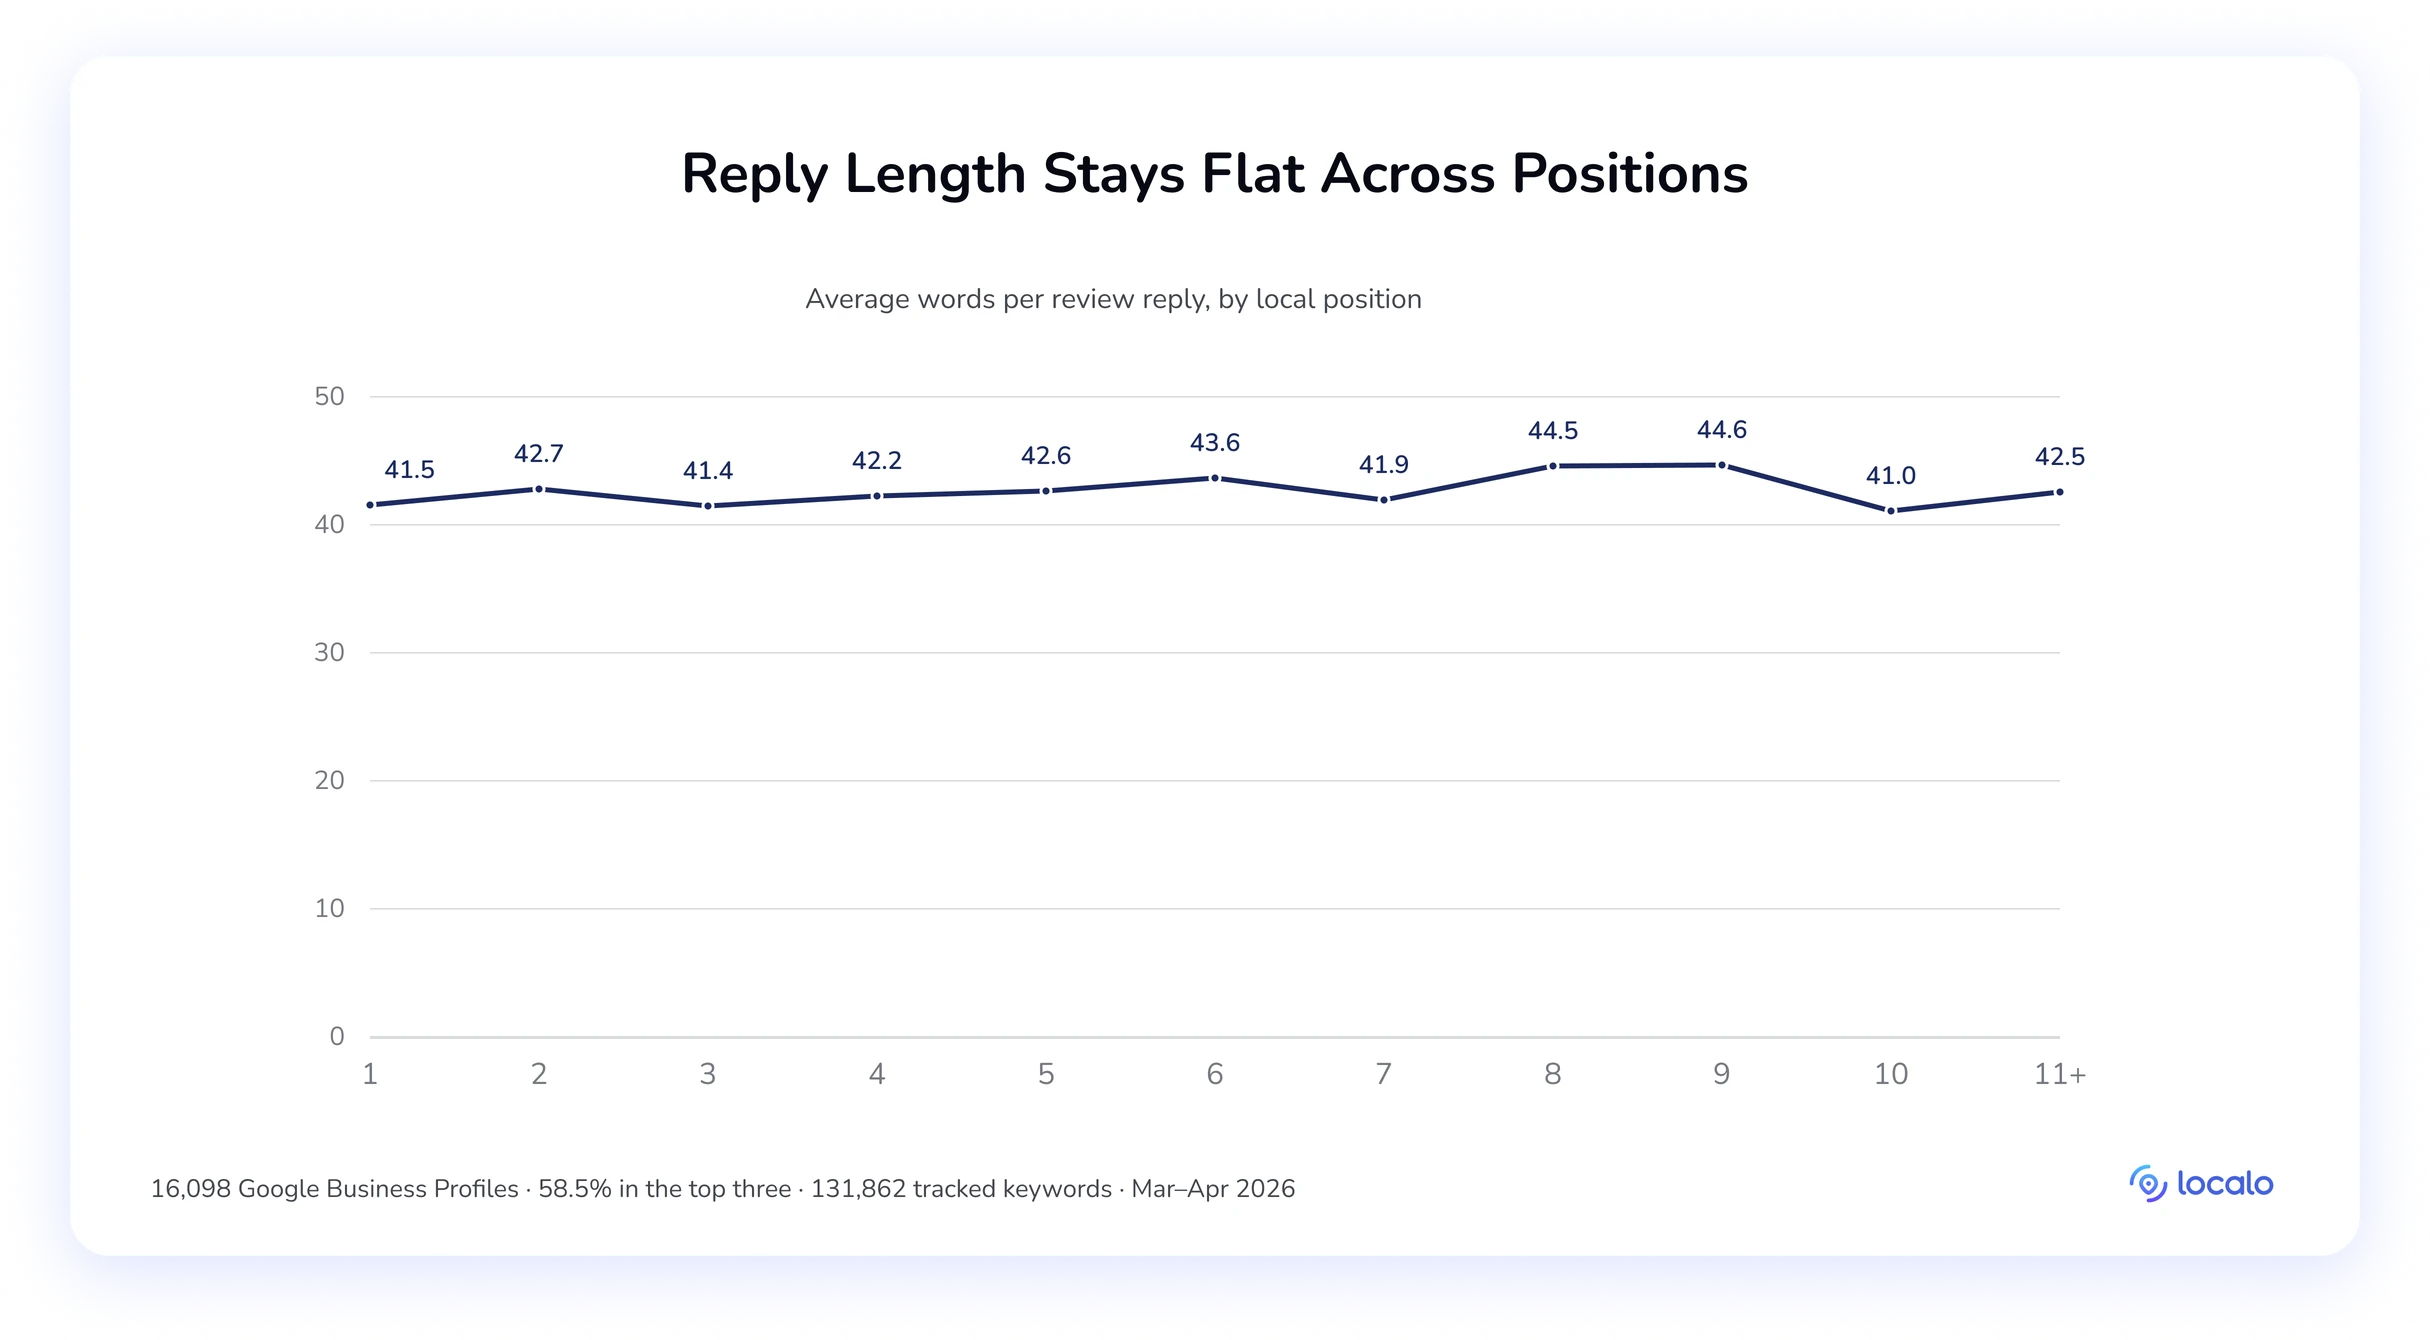
So the profiles doing the most review management are the ones ranking worst? Read that carefully, because it doesn’t mean replying hurts. It means reply effort tracks need rather than result: businesses under pressure answer everything, and businesses already winning won’t pay too much attention to it now. Reply length behaves identically: around 42 words at every position from #1 to #11+, with the top three writing marginally shorter replies than the groups below.
🔎 Key takeaway:
Top-ranked profiles don’t reply more. Replying builds trust, and it’s worth doing for that reason alone, but nothing in the position data suggests it’s what got those profiles to the top. If the brief is ranking, replies aren’t where the hours go.
Busted: Longer description means better ranking
Having a description matters, as the description section shows. Length is a separate question, and it’s the one specialists burn hours on.
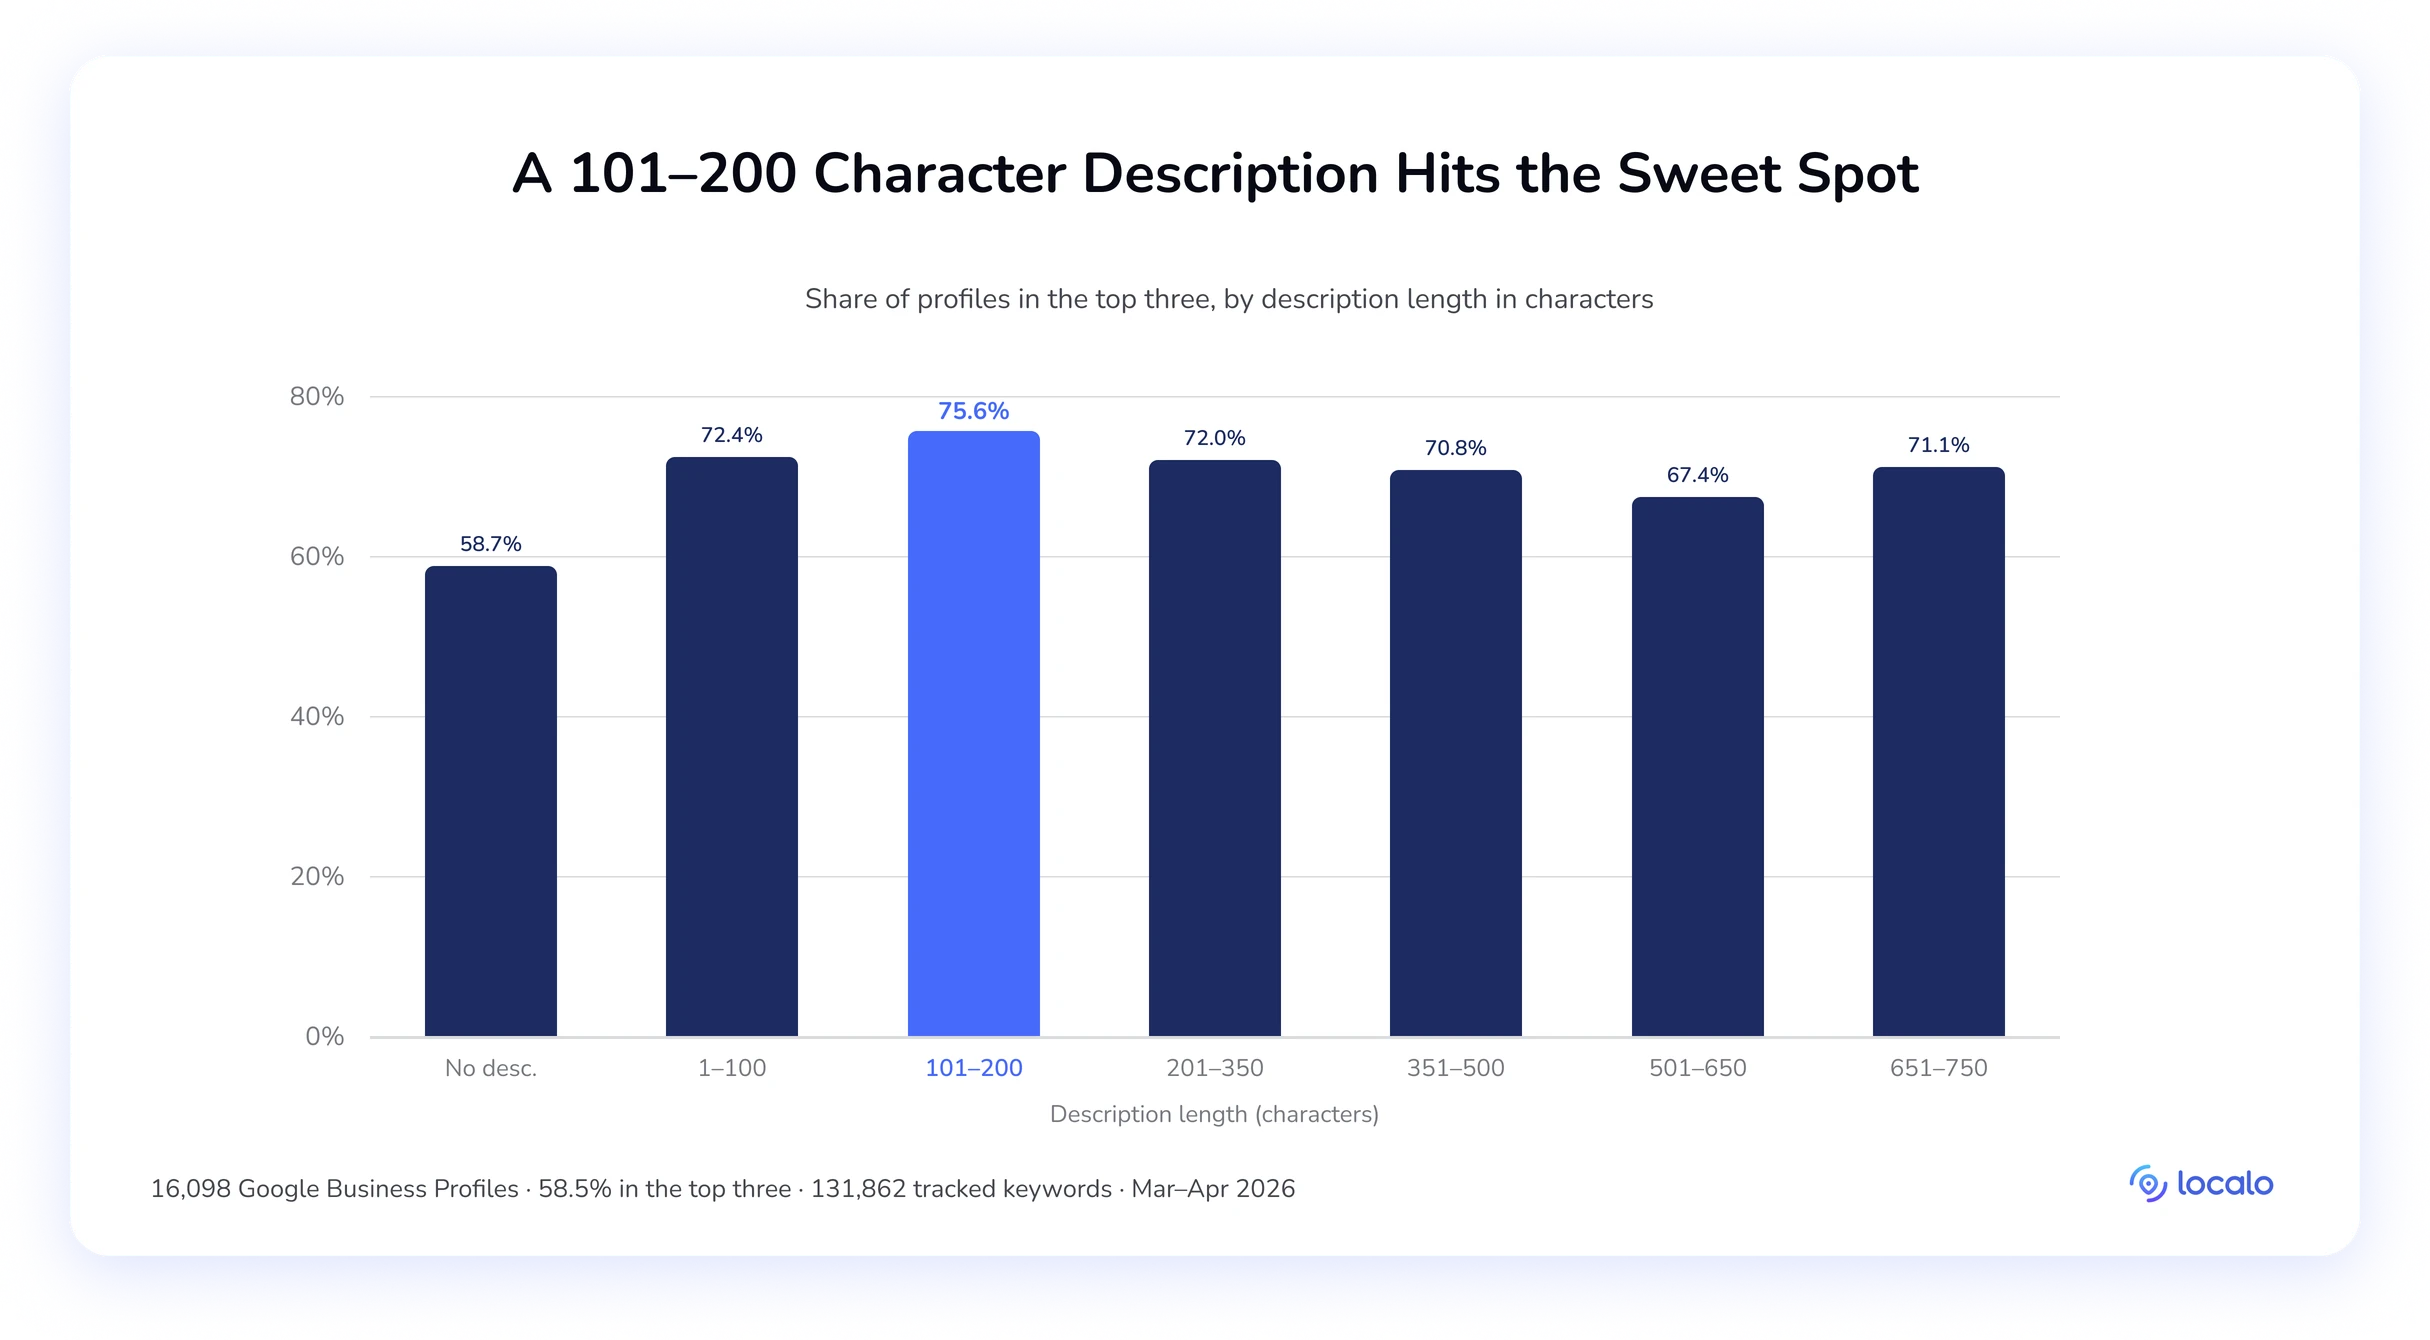
Having any description lifts the top-three rate from 58.7% to 72.4%, a 13.7-point step. After that, length barely matters, and the curve wobbles rather than climbs: 72.4% at 1–100 characters, 75.6% at 101–200, 72.0% at 201–350, 70.8% at 351–500, 67.4% at 501–650, then back up to 71.1% at 651–750.
The bracket curve there has no direction to follow: the strongest band is the second-shortest, the weakest is the second-longest, and it recovers at the very end. Position by position, it’s even flatter: #1 averages 672 characters against 652 at #11+. The conclusion is that writing a description matters enormously, and polishing the character count doesn’t.
🔎 Key takeaway:
Make sure every GBP you manage has a description, then leave it alone. There’s no length target in this data; the curve wobbles instead of climbing, and 100–200 characters performs as well as anything longer.
Busted: Google considers business website URL factors
Localo checked three things: keywords in the domain name, keywords in the URL path, and HTTPS versus HTTP.
Profiles with a keyword in the domain rank top-three 70.1% of the time against 70.2% without one, a tenth of a point, and in the wrong direction.
HTTPS profiles come in at 70.0% against 70.9% for plain HTTP, which again favors the supposedly worse option by under a point.
Keyword-in-URL-path prevalence holds at 12–14% regardless of position, so there’s nothing there either, though we measured that one as prevalence rather than a top-three comparison.
🔎 Key takeaway:
A client’s domain name is not a local ranking lever, and neither is their certificate. Having a website is a baseline, but what sits inside the URL shows no correlation with a Google Business Profile’s ranking: not keyword placement, not HTTPS versus HTTP. Fix HTTPS anyway for the ordinary reasons: browser warnings and referral data quality.
Local SEO ranking factors to focus on when rankings drop
While performing our Google Business Profile ranking factors study, we noticed that ranking doesn’t decline steadily. Two transitions matter more than all the others, and they’re the two boundaries this study is built around: the step where a profile leaves the visible local 3-pack, and the step where it leaves page one. Everywhere else, the metrics drift.
The local-pack-exit cliff (#3-to-#4). Reviews lead: the median count falls 14 in one step, from 62 to 48. Photos slip too, from 35 to 33, and both address verification (−2pp) and description presence (−0.8pp) follow. Four metrics moving together is what makes this a cliff rather than a gradient. It’s where a profile stops appearing in the local pack at all.
The page-one-boundary cliff (#10-to-#11+). All four metrics move at once, and by wider margins than at #3-to-#4: reviews drop 17 (42 to 25), photos drop 6 (27 to 21), verified addresses fall 7pp (90.4% to 83.4%), and descriptions ease 3pp (92.2% to 89.2%). Every one posts its steepest single-step move here. That’s what makes the page boundary the most punishing step in local search.
Between and around those boundaries, positions shift without such abrupt losses. But one gap is worth naming separately: #1 to #2 costs only 14 reviews and 8 photos, the largest photo gap anywhere in our data. Not a cliff, because both profiles sit in the pack and both get seen, just the price of first place.
🔎 Key takeaway:
- For GBPs in positions #2–3: a competitive gap rather than a cliff, both profiles are already visible. The clearest separation from #1 is reviews and photos, where the #1 median is 79 reviews and 44 photos.
- For GBPs in positions #4–10: reviews show the widest gap back into the pack, with #4 at a median of 48 against 62 at #3.
- For GBPs in positions #11+: every metric sits behind the pack at once, with no single factor separating this group from page one.
Reading these numbers: population medians, not targets
These are population-wide figures. They describe what profiles at each position tend to look like across 16,098 businesses, not thresholds a given profile has to hit to rank. Local position is decided first by proximity, how close the business sits to the searcher. Only inside that radius does comparison to the actual competing profiles start to matter, and that comparison is against those specific competitors, not the medians of the whole population. Read everything below as observation, not a scorecard: relevance, prominence, and distance sit entirely outside this data.
Across 16,098 profiles, the clearest divide isn’t any single factor. It’s whether the basics are finished at all. 42.7% of #1-ranked profiles meet all eight completeness criteria: verified address, website, description, at least one additional category, 10+ reviews, 10+ photos, 10+ citations, at least one social link. At #11+, 17.2% do. A 2.5× difference, and it runs as a gradient through every position between.
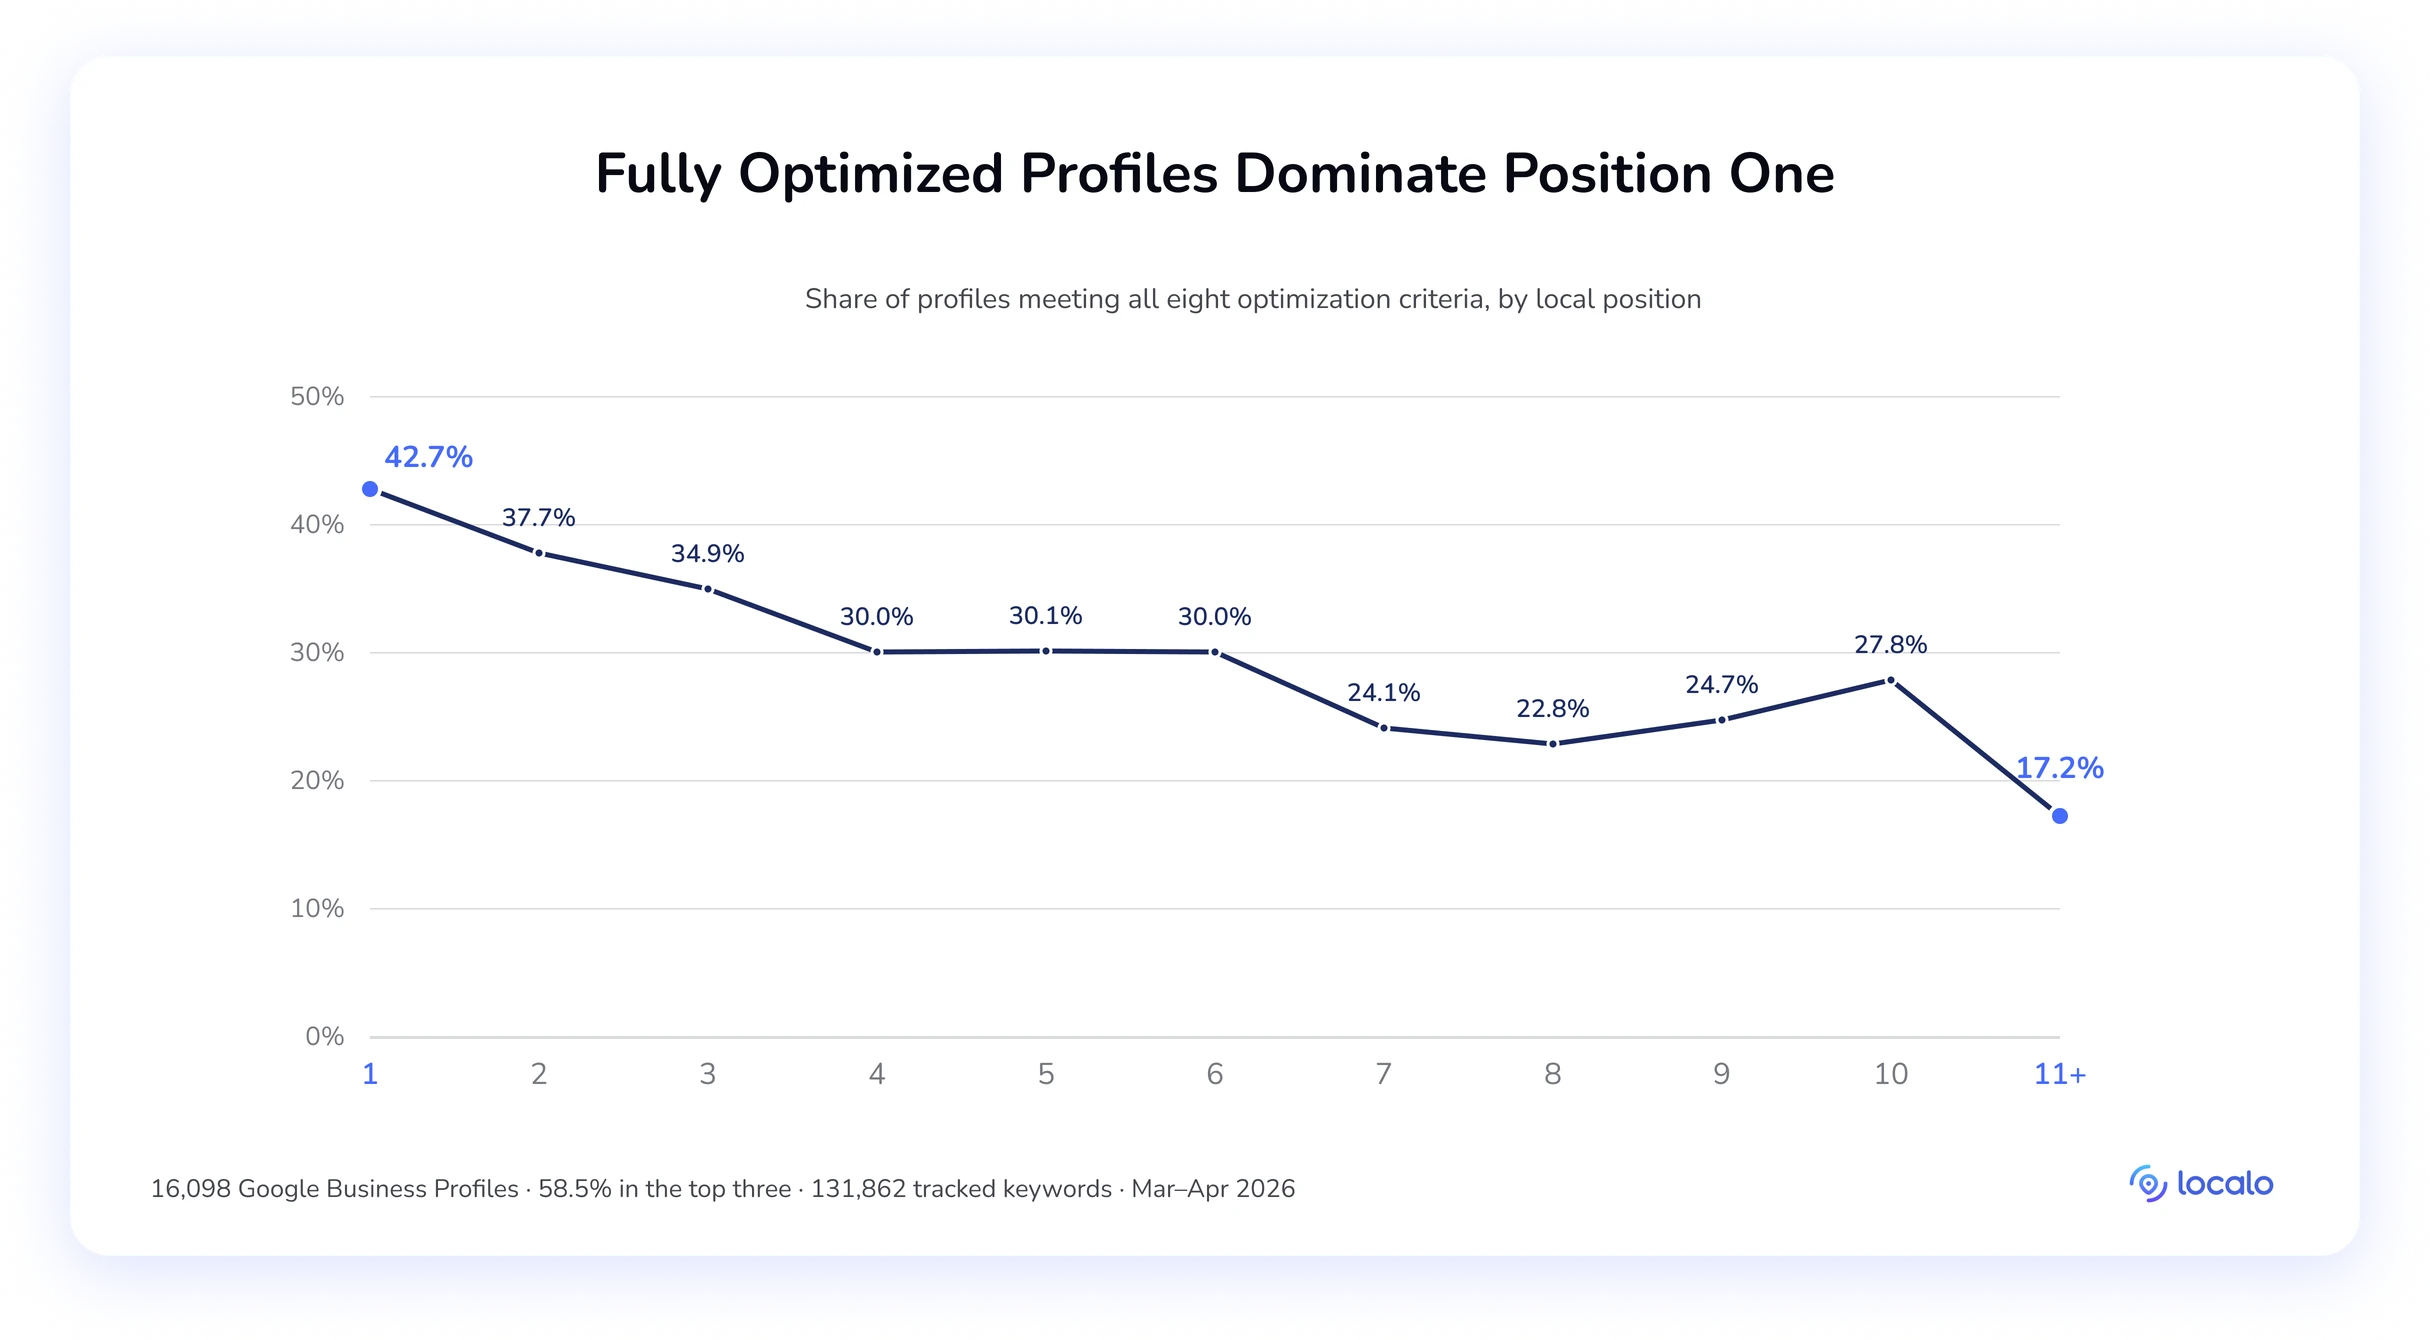
Look at how low those thresholds are. Eight boxes, most of them an afternoon’s work, and well over half of page-one profiles still don’t tick all of them. Completeness is the clearest thing separating the top of this data from the bottom, but even that is a correlation observed across the population, not a lever that moves a specific profile up within its local radius.
What profiles at each position have
Every number below is what profiles at that position actually have, drawn from the sections above and gathered in one place. The columns describe populations, not targets.
| Factor | #11+ | #10 | Top three | #1 | Where to stop* |
|---|---|---|---|---|---|
| Reviews (median) | 25 | 42 | 62–79 | 79 | 100, curve flattens past 200 |
| Photos (median) | 21 | 27 | 35–44 | 44 | no ceiling found, still climbing at 500+ (73.2%) |
| Citations (median) | 14 | 16 | 21–27 | 27 | 20–30, erratic above |
| Categories (avg) | 2.7 | 2.8 | 3.2–3.7 | 3.7 | 6 (69.1%, the highest of any count) |
| Social links (avg) | 2.3 | 2.5 | 2.8–3.0 | 3 | 5 (68.0%, flat above and 4 is a dead rung) |
| Rating (avg) | 4.77 | 4.79 | 4.78–4.79 | 4.79 | 4.9 (69.1%, drops to 53.6% at 5.0) |
| Has description | 89.2% | 92.2% | 95.7% | 95.7% | present, length irrelevant |
| Publishes posts | 76.6% | 85.2% | 84–87.3% | 87.3% | 10+ active posts (73.0%) |
*The position columns and the last one answer different questions, and they’re drawn from different populations. The position columns describe what profiles ranking there actually have. The last column is where each curve stops paying, not always the single highest reading. Reviews technically peak at 201–500 (73.0%) and citations at 200+ (69.1%), but both curves flatten long before that, so those readings aren’t worth chasing. The position columns describe what profiles ranking there have; the last column is where each curve stops tracking with position.
One pattern here is worth flagging for any Google Business Profile optimization work: completeness compounds rather than merely adds. A description is worth +10.8pp on a profile with ten reviews or fewer and as many as +25.8pp on one with 200+. But a pattern that compounds across the population is not a guaranteed gain for any one profile, whose position still turns first on proximity to the searcher.
The factors that don’t separate profiles by position
Website, verified address, and the business name don’t separate profiles by position. Between 93.9% and 97.7% of profiles at every position have a website, and addresses hold above 89.0% across the whole top ten, so their presence doesn’t distinguish one rank from another, though a profile missing one sits outside contention entirely.
The name is a different case: longer names do correlate with better positions, but Google prohibits padding one, so title length isn’t something a profile can act on.
The metrics with no pattern
Review velocity. Review length. Reply rate. Reply length. Description length. Keywords in review text. Keywords in the domain or URL path. And everything inside Google Posts except the count. None of these shows a pattern that tracks with position in this data.
Methodology
The Localo team gathered this data in March–April 2026, drawn from 16,098 Google Business Profiles, spanning hundreds of business categories and geographic regions, collected through Localo’s own data infrastructure. Profiles were grouped two ways: positions #1–3, #4–10 and #11–20 for the grouped view, and #1 through #10 individually plus #11+ for the per-position view. The two bottom groups aren’t interchangeable: #11–20 stops at #20, #11+ doesn’t, so we label which one is in use throughout.
Collection ran across a single 6-month window ending in March 2026, and positions reflect where a profile ranked at the time it was collected. Position data comes from Position Map, the tracked-keyword data from Keywords Tracking, so both reflect what Localo users were actively monitoring rather than a synthetic crawl.
Seventeen metrics were calculated per position group: review count (median), review rating (average), rating thresholds (4.5+ and 5.0), photo count (median), social media links, Google Posts, website presence, address verification, description presence, description length, additional categories, citations (median), title length, review frequency, review length, review replies (rate and length), and full optimization score. Several of these yield more than one finding, which is why the article reports more than 17 results. The keyword analysis and the website URL checks (keywords in domain, keywords in URL path, HTTPS) sit outside the 17 as separate tests.
Review and post metrics come from the 10 most recent of each. Frequency is derived from the date span of those 10, so it reflects current activity rather than lifetime pace. Citations were counted as active directory listings via a crawl of major citation sources, both general directories and industry-specific platforms, matching what Citations Manager tracks. Social links were taken from GBP profile data.
The keyword analysis matched 131,862 keywords that businesses were actively tracking across multiple language markets against each profile’s title, description, review text and last 10 posts, using five methods: exact phrase, all words, any word, and stem matching on four- and five-character roots.
All comparisons use observed frequencies and conditional probabilities. Medians were used for count-based metrics, averages only where distributions are close to normal (rating, title length), and percentages for binary metrics. Controlled analyses hold one variable constant while varying another to isolate a single factor.
On sample composition: these are profiles belonging to businesses actively tracking their local rankings in Localo, and the sample leans toward strong performers, with 58.5% of it sitting in positions #1–3. That’s deliberate, and it’s what makes this position-by-position view possible. Around 9,400 of these profiles genuinely hold top-three positions, so “what does a #1 profile look like” has a large population behind it rather than a handful of examples. The trade-off is that every rate reported here is a share within that population, not the odds a given business has of reaching the top three.
Two limitations to read this with. It is observational data showing correlation, not causation. And position is influenced by much that a profile can’t capture: proximity, authority, and live search data.
FAQs about local ranking factors
What is the most important local search ranking factor?
Review count is the strongest local ranking factor we measured.
Sorted by review count, the top-three rate climbs from 39.3% for profiles with 1–5 reviews to 73.0% at 201–500. That 33.7-point spread is wider than any other factor produces. The medians say the same thing: 74 reviews for top-three profiles against 30 at positions #11–20.
How many Google reviews to rank in the top three?
No review count guarantees a top-three position, but crossing 10 reviews takes a profile past a 50.0% top-three rate, and 100 is where top performers cluster.
Profiles with 6–10 reviews rank top-three 43.1% of the time; at 11–20 that rises past the halfway mark to 50.8%. From there it climbs to 57.1% at 21–50 and 64.5% at 51–100, with top performers clustering at 101–200 (68.9%). The curve peaks at 201–500 (73.0%), then slips back to 70.7% above 500, so there’s nothing left to win past a few hundred.
In position terms, the median #1 profile carries 79 reviews and the median #3 carries 62, making 62–79 the top-three band. The median at #11+ is 25; below that, profiles are mostly off the local pack’s first page. Watch for reviews Google removes too, since deletions can pull a profile back under that floor.
How many Google reviews should I be getting a month?
There’s no monthly review rate to aim for: pace doesn’t track with position, only total review count does.
Sorted by monthly review rate, top-three performance runs 70.2% for profiles earning under one review a month, 72.5% at one to two, 73.0% at two to five, 71.7% at five to ten, 71.5% at ten to thirty, and 73.5% above thirty. Only 3.3 points separate the best bracket from the worst, and they don’t line up in any order; the second-highest reading sits in the middle of the range.
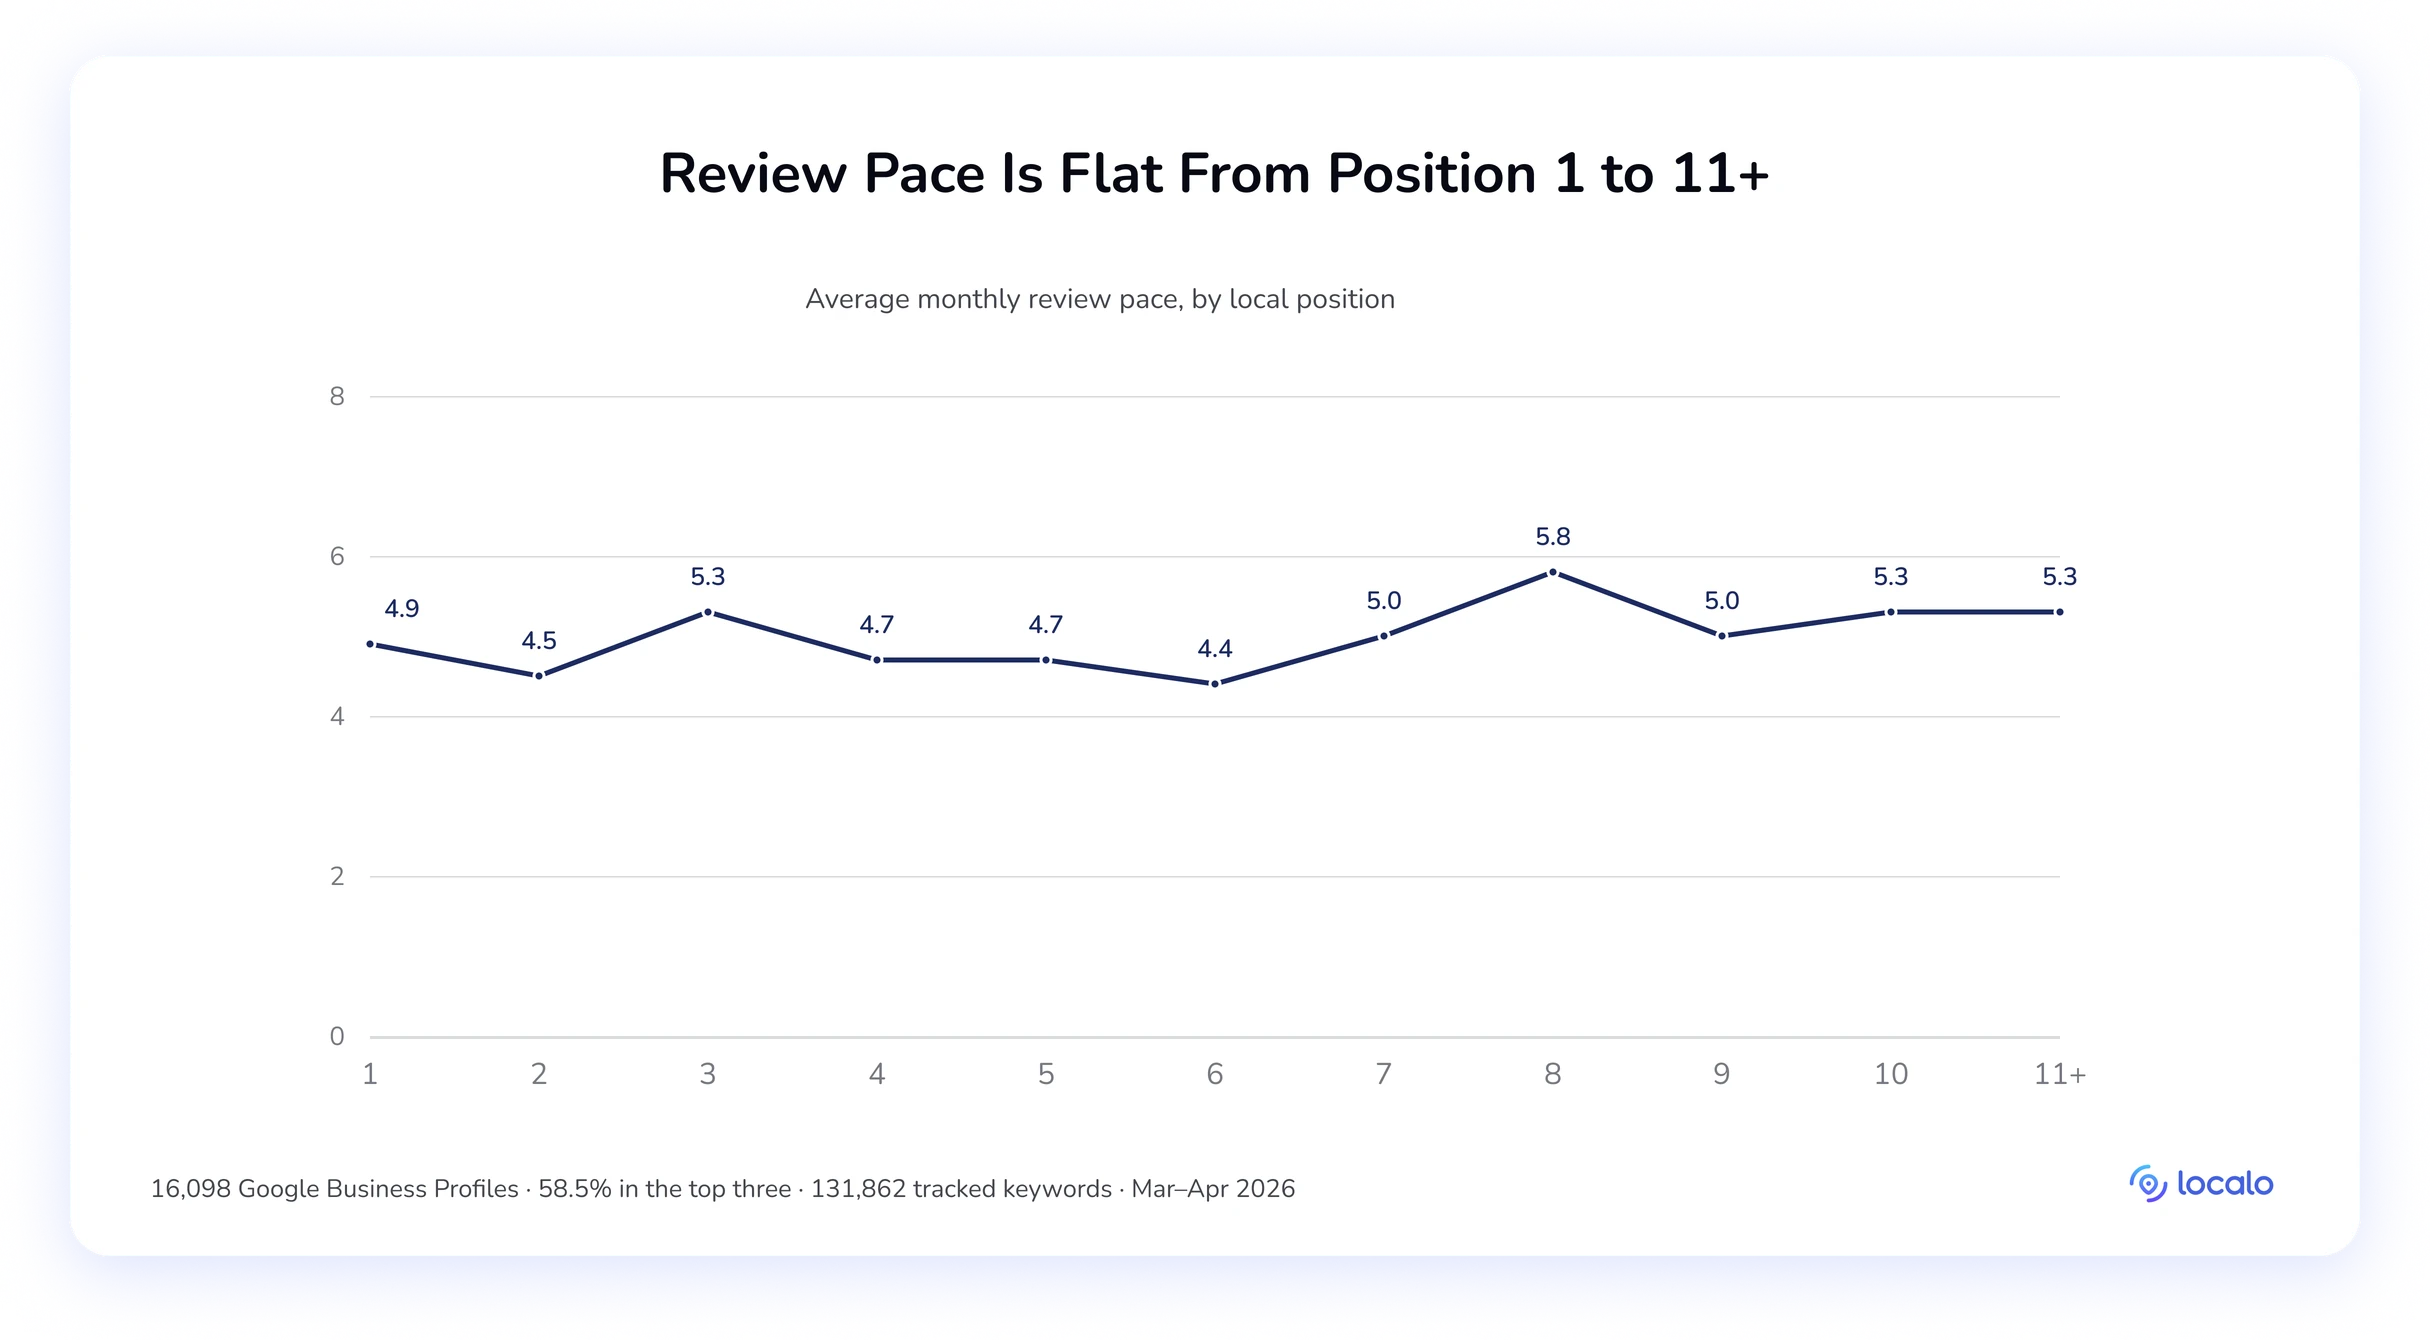
Position by position, it’s just as flat: the median at #1 is 4.9 reviews a month, at #11+ it’s 5.3. Total count separates them, not the rate. The one caveat is a genuinely extreme burst, which can get reviews flagged and removed, and that costs you count.
What’s the biggest difference between position #1 and position #2?
The widest measured gap between #1 and #2 is photos, a median of 44 against 36.
The #1-to-#2 median photo gap (44→36 = -18.2%) is the widest #1-to-#2 gap of any metric we measured, just ahead of reviews at -17.7%. The good news is that it’s an actionable factor, and you can easily improve the photo count on a profile in a short time.
Is a 5-star rating necessary to rank on page 1?
A 5-star rating isn’t necessary for page one, and a perfect 5.0 actually ranks worse than a 4.9: 53.6% against 69.1%.
Across #1 through #10, the share of profiles rated 4.5 or above runs between 77.0% and 84.4%, with no clear order: #9 sits at 83.4%, above #2’s 82.1%. At #11+ it’s 74.7%, so the gap between the bottom of page one (78.7% at #10) and everything below is just 4 points. To reach page one, rating barely sorts you.
Where it sharpens is at the very top: 84.4% of #1 profiles clear 4.5. Above that line, higher stops tracking with better placement, because a perfect score usually means the review count is too low to compete.
Does responding to Google reviews help SEO?
Responding to reviews doesn’t help ranking, and the correlation runs backwards: top-three profiles reply less than lower-ranked ones.
Profiles in the top three average a 73.4% reply rate against 76.7% at positions #11–20. At the extremes it’s the same story: 50.2% of profiles at 11–20 reply to every single review, against 47.0% of top-three profiles.
That doesn’t mean replying hurts. The likeliest reading is that reply effort follows anxiety rather than success; the profiles working hardest at review management are the ones with the most ground to make up. Reply length shows the same pattern and the same flatness, hovering near 42 words wherever a profile ranks. Reply for reputation, which it does build. Don’t reply expecting position.
Do Google Business Profile posts help local SEO?
Google Business Profile posts help in one dimension only: publishing at all is worth +7.1pp, and nothing inside posting matters to rankings.
Profiles that publish posts rank top-three 70.8% of the time against 63.7% for those that don’t, a +7.1pp gap. Volume adds to that: 10 or more active posts reach 73.0% against 66.0% at one to nine, so the full span from no posts (63.7%) up to 10+ is 9.3 points.
Everything inside posting is flat. Frequency sits at roughly five posts a month at every position from #1 to #11+, length at about 107 words, and offer posts (71.5%) barely separate from standard-only (70.6%). Category keywords in post text show no difference: 70.8% either way, and the separate 131K-keyword analysis finds only a marginal +1.8pp for word stems. Publish, keep publishing, and stop optimizing the posts themselves.
Which local ranking factor should I fix first?
Fix review count first, then photos, then profile completeness.
It depends where the profile sits now, which is what the section on rankings dropping covers above. Taking that default order: review count first, since it shows the widest spread of any factor we measured; then photos, the only factor with no ceiling in the data and the widest #1-to-#2 gap. After those two, build citations to 21–27, take secondary categories to 6, and add social links up to about five. Beyond that the curve stops moving, so it’s a task with a finish line rather than an ongoing one.
Sources
- Google Business Profile Help, Manage your Business Profile description
- Google Business Profile Help, Tips to improve your local ranking on Google
- Google Business Profile Help, Verify your business with a video recording
- Sterling Sky, Do Keywords in Business Names on Google Maps Impact Ranking?
- Whitespark, 2026 Local Search Ranking Factors